> ## Documentation Index
> Fetch the complete documentation index at: https://docs.upsolve.ai/llms.txt
> Use this file to discover all available pages before exploring further.
# Agent Observability
> Inspect the step-by-step trace of how your agent answered a question.
Every response your agent produces is the result of a sequence of steps: generating SQL, executing it, interpreting the results, and producing a chart. Agent Observability gives you a detailed trace of that entire process — so you can understand exactly why an answer came out the way it did, and where to make improvements when it doesn't.
## Accessing observability
You can reach the observability trace for any agent response in two ways.
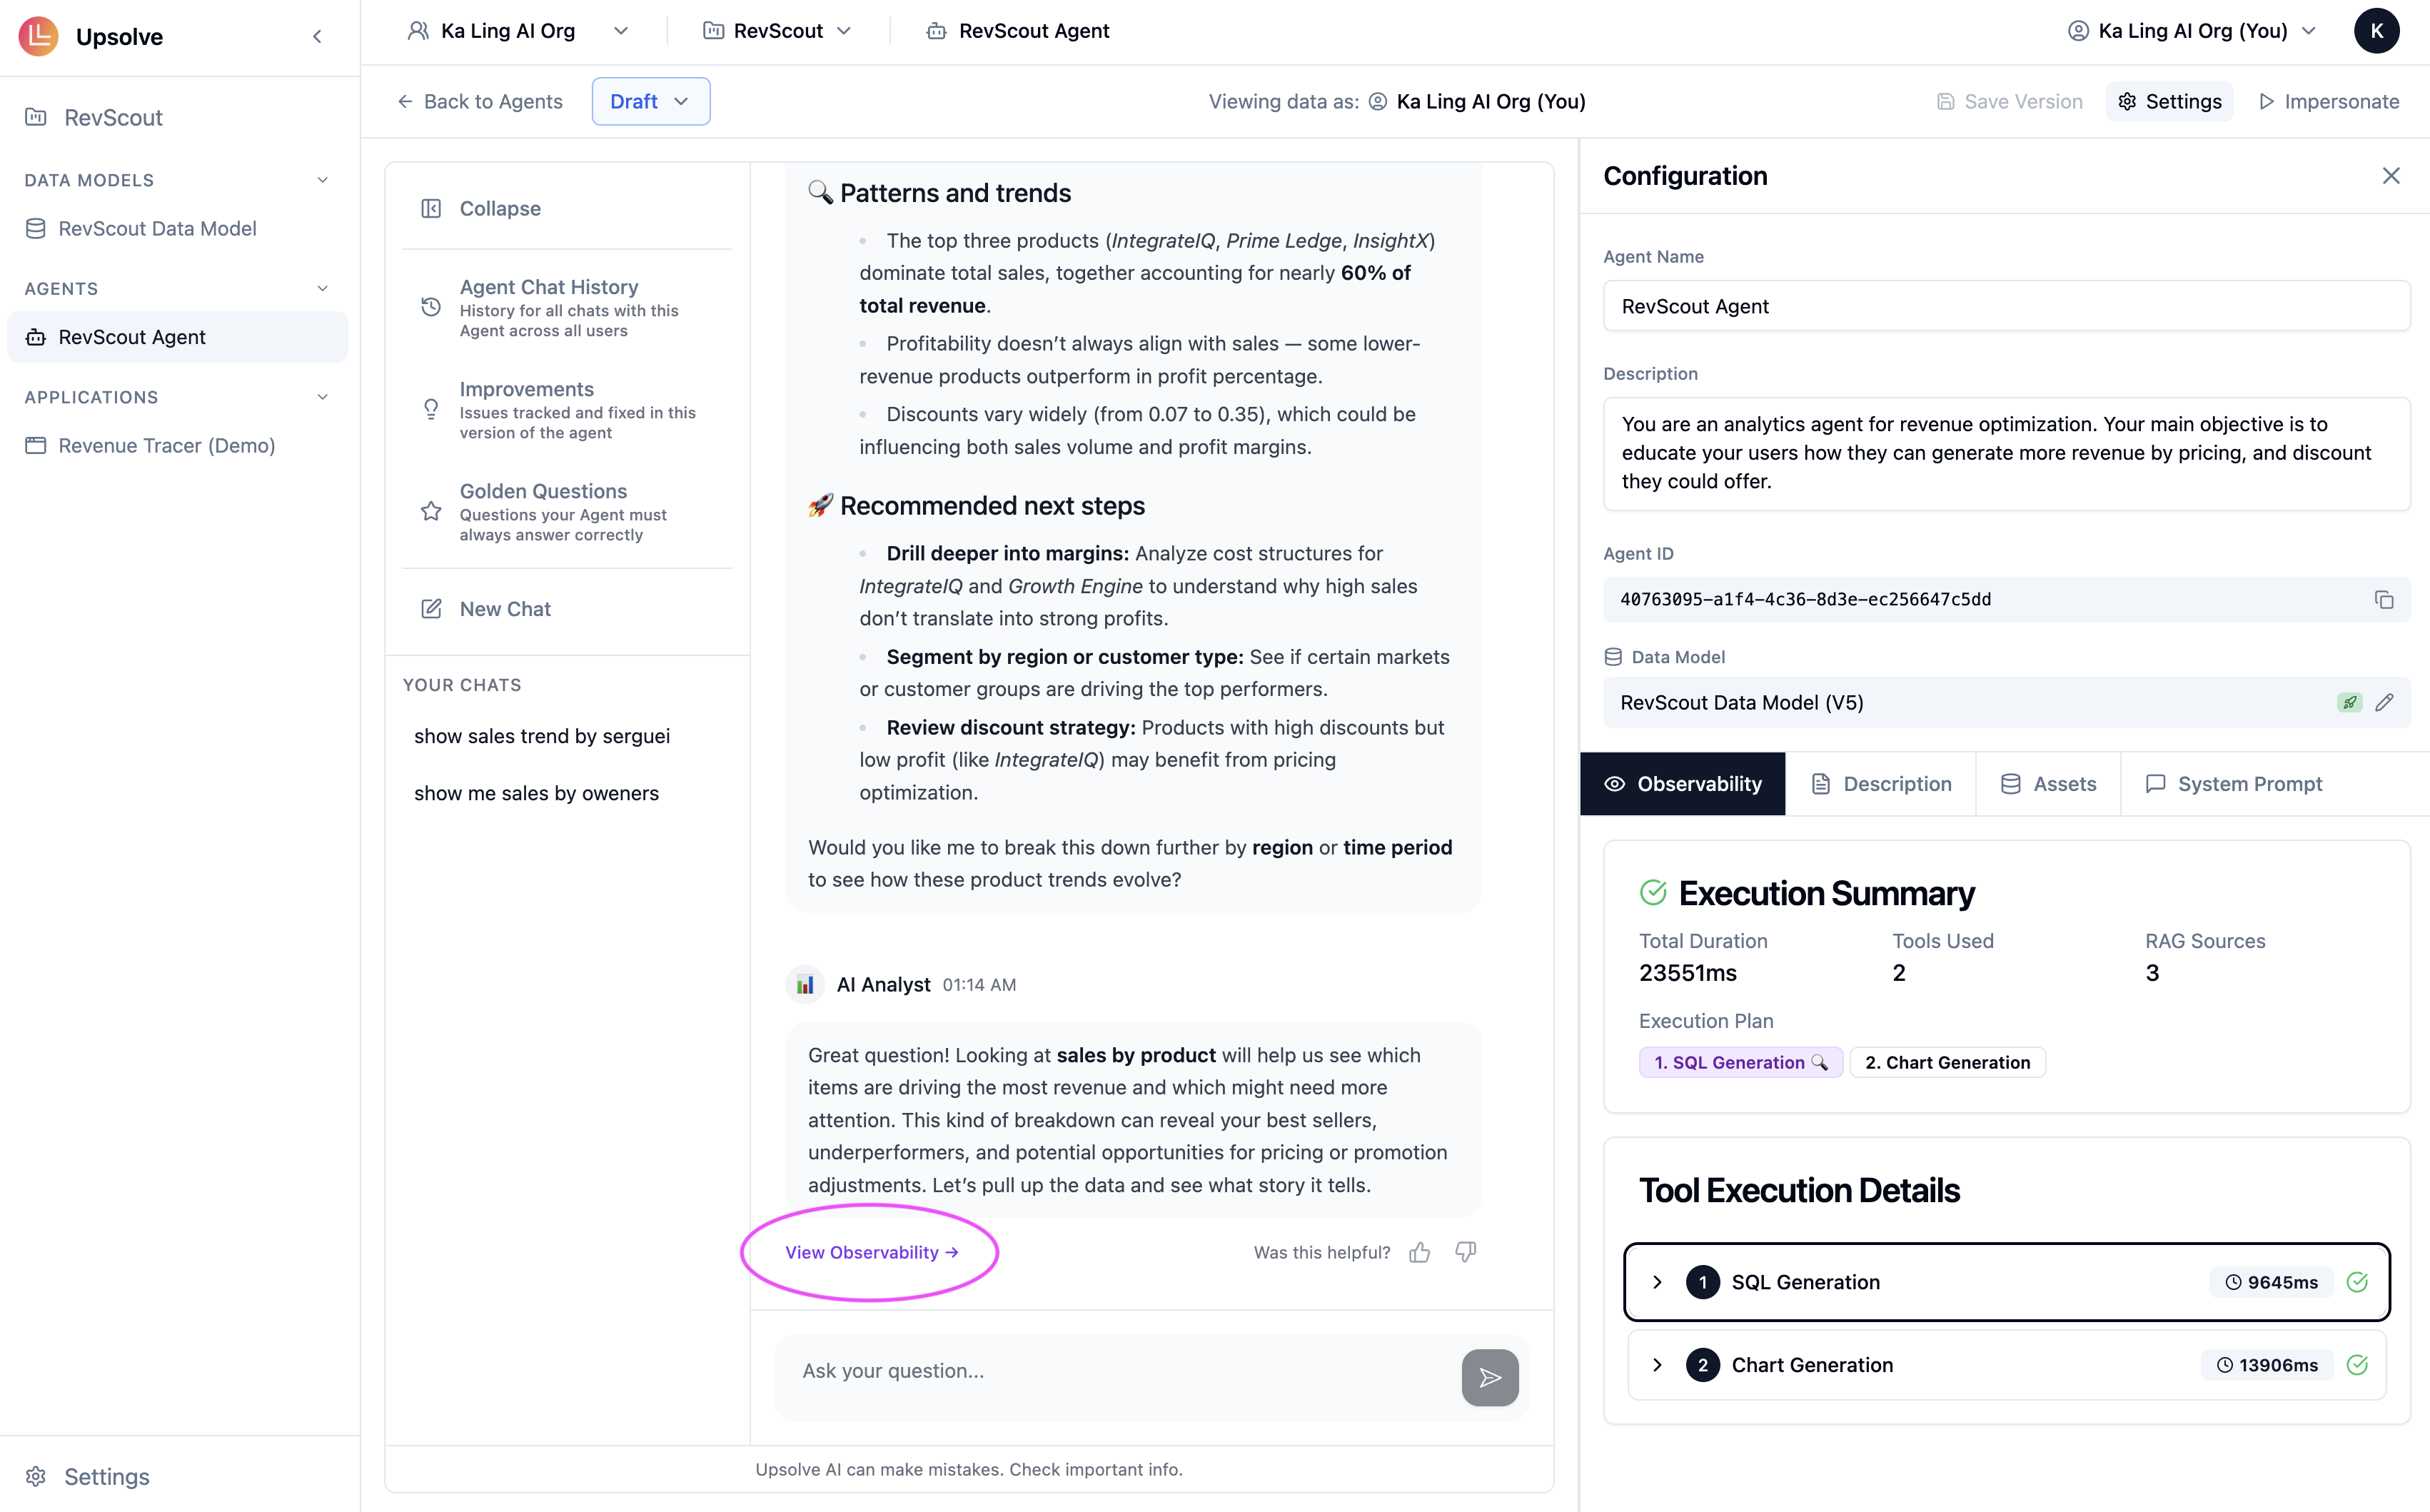
**From an active chat session** — After the agent responds, click **View Observability** at the bottom of the response. This opens the full trace for that specific exchange.
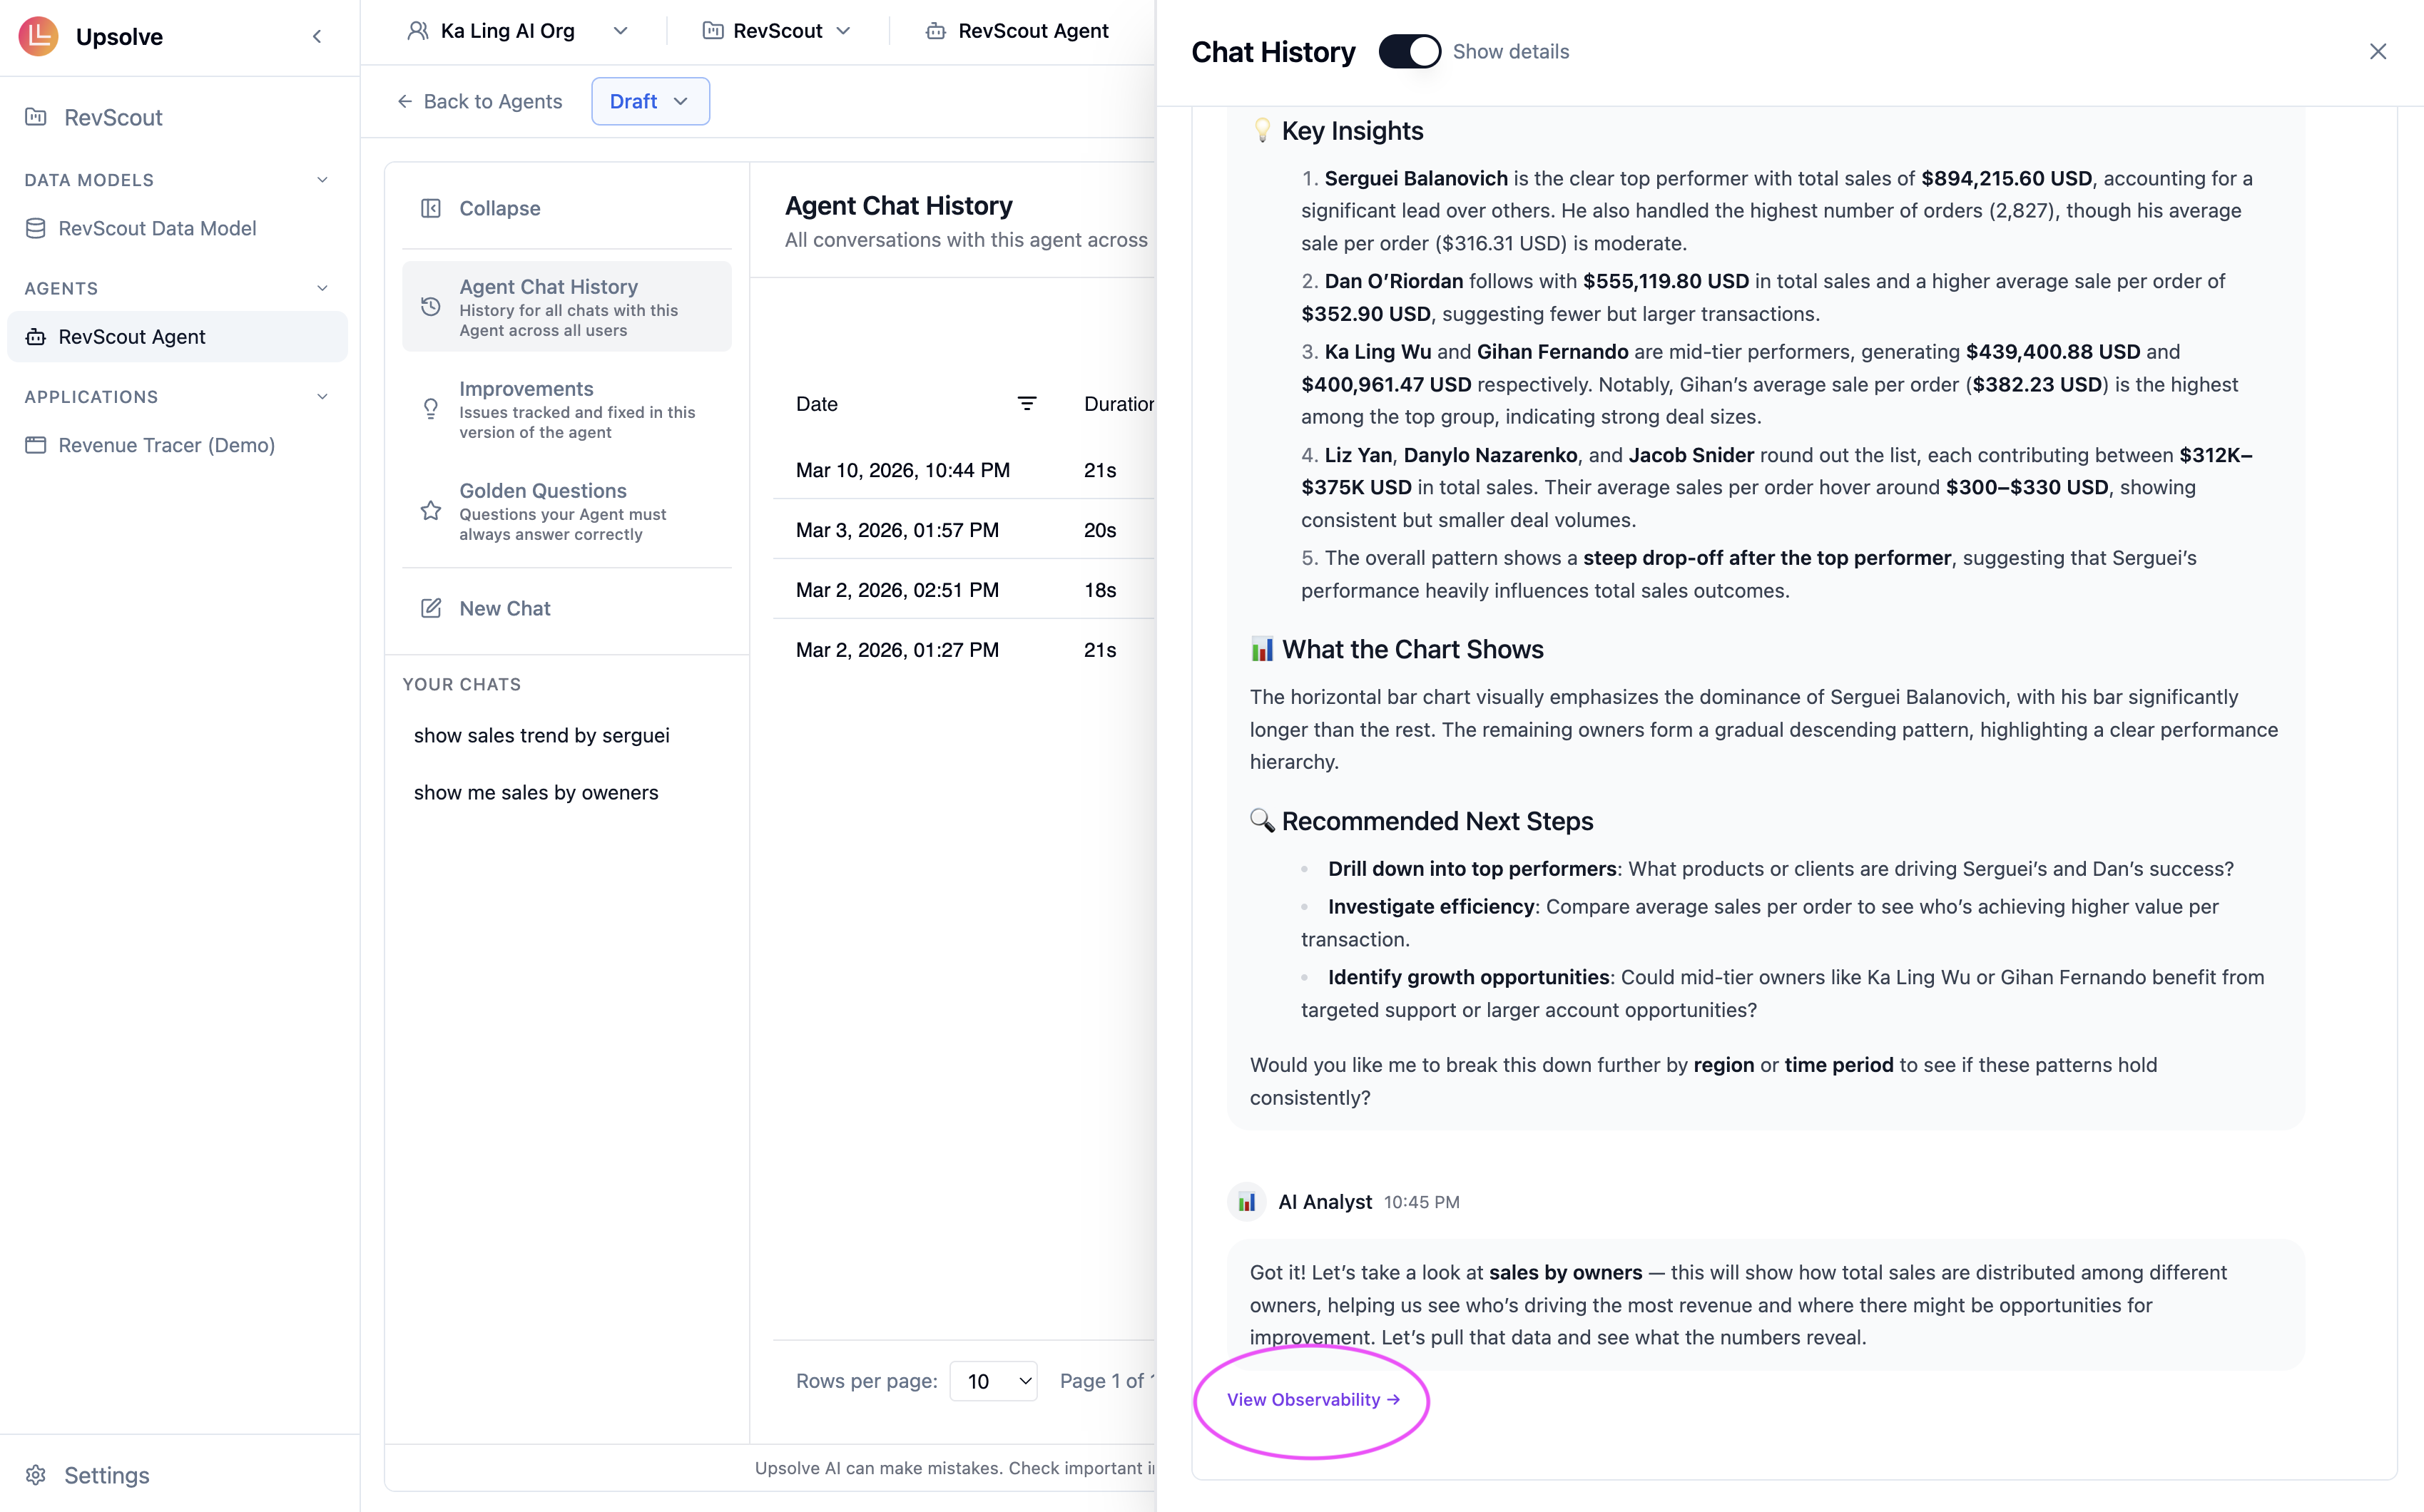
 **From Chat History** — Open [Chat History](/ai-agent-builder/chat-history), select a conversation, and toggle on **Show Details**. The **View Observability** button will appear at the bottom of each agent response in the thread.
 ## What the trace shows
The observability panel breaks each agent response down into its constituent steps.
## What the trace shows
The observability panel breaks each agent response down into its constituent steps.
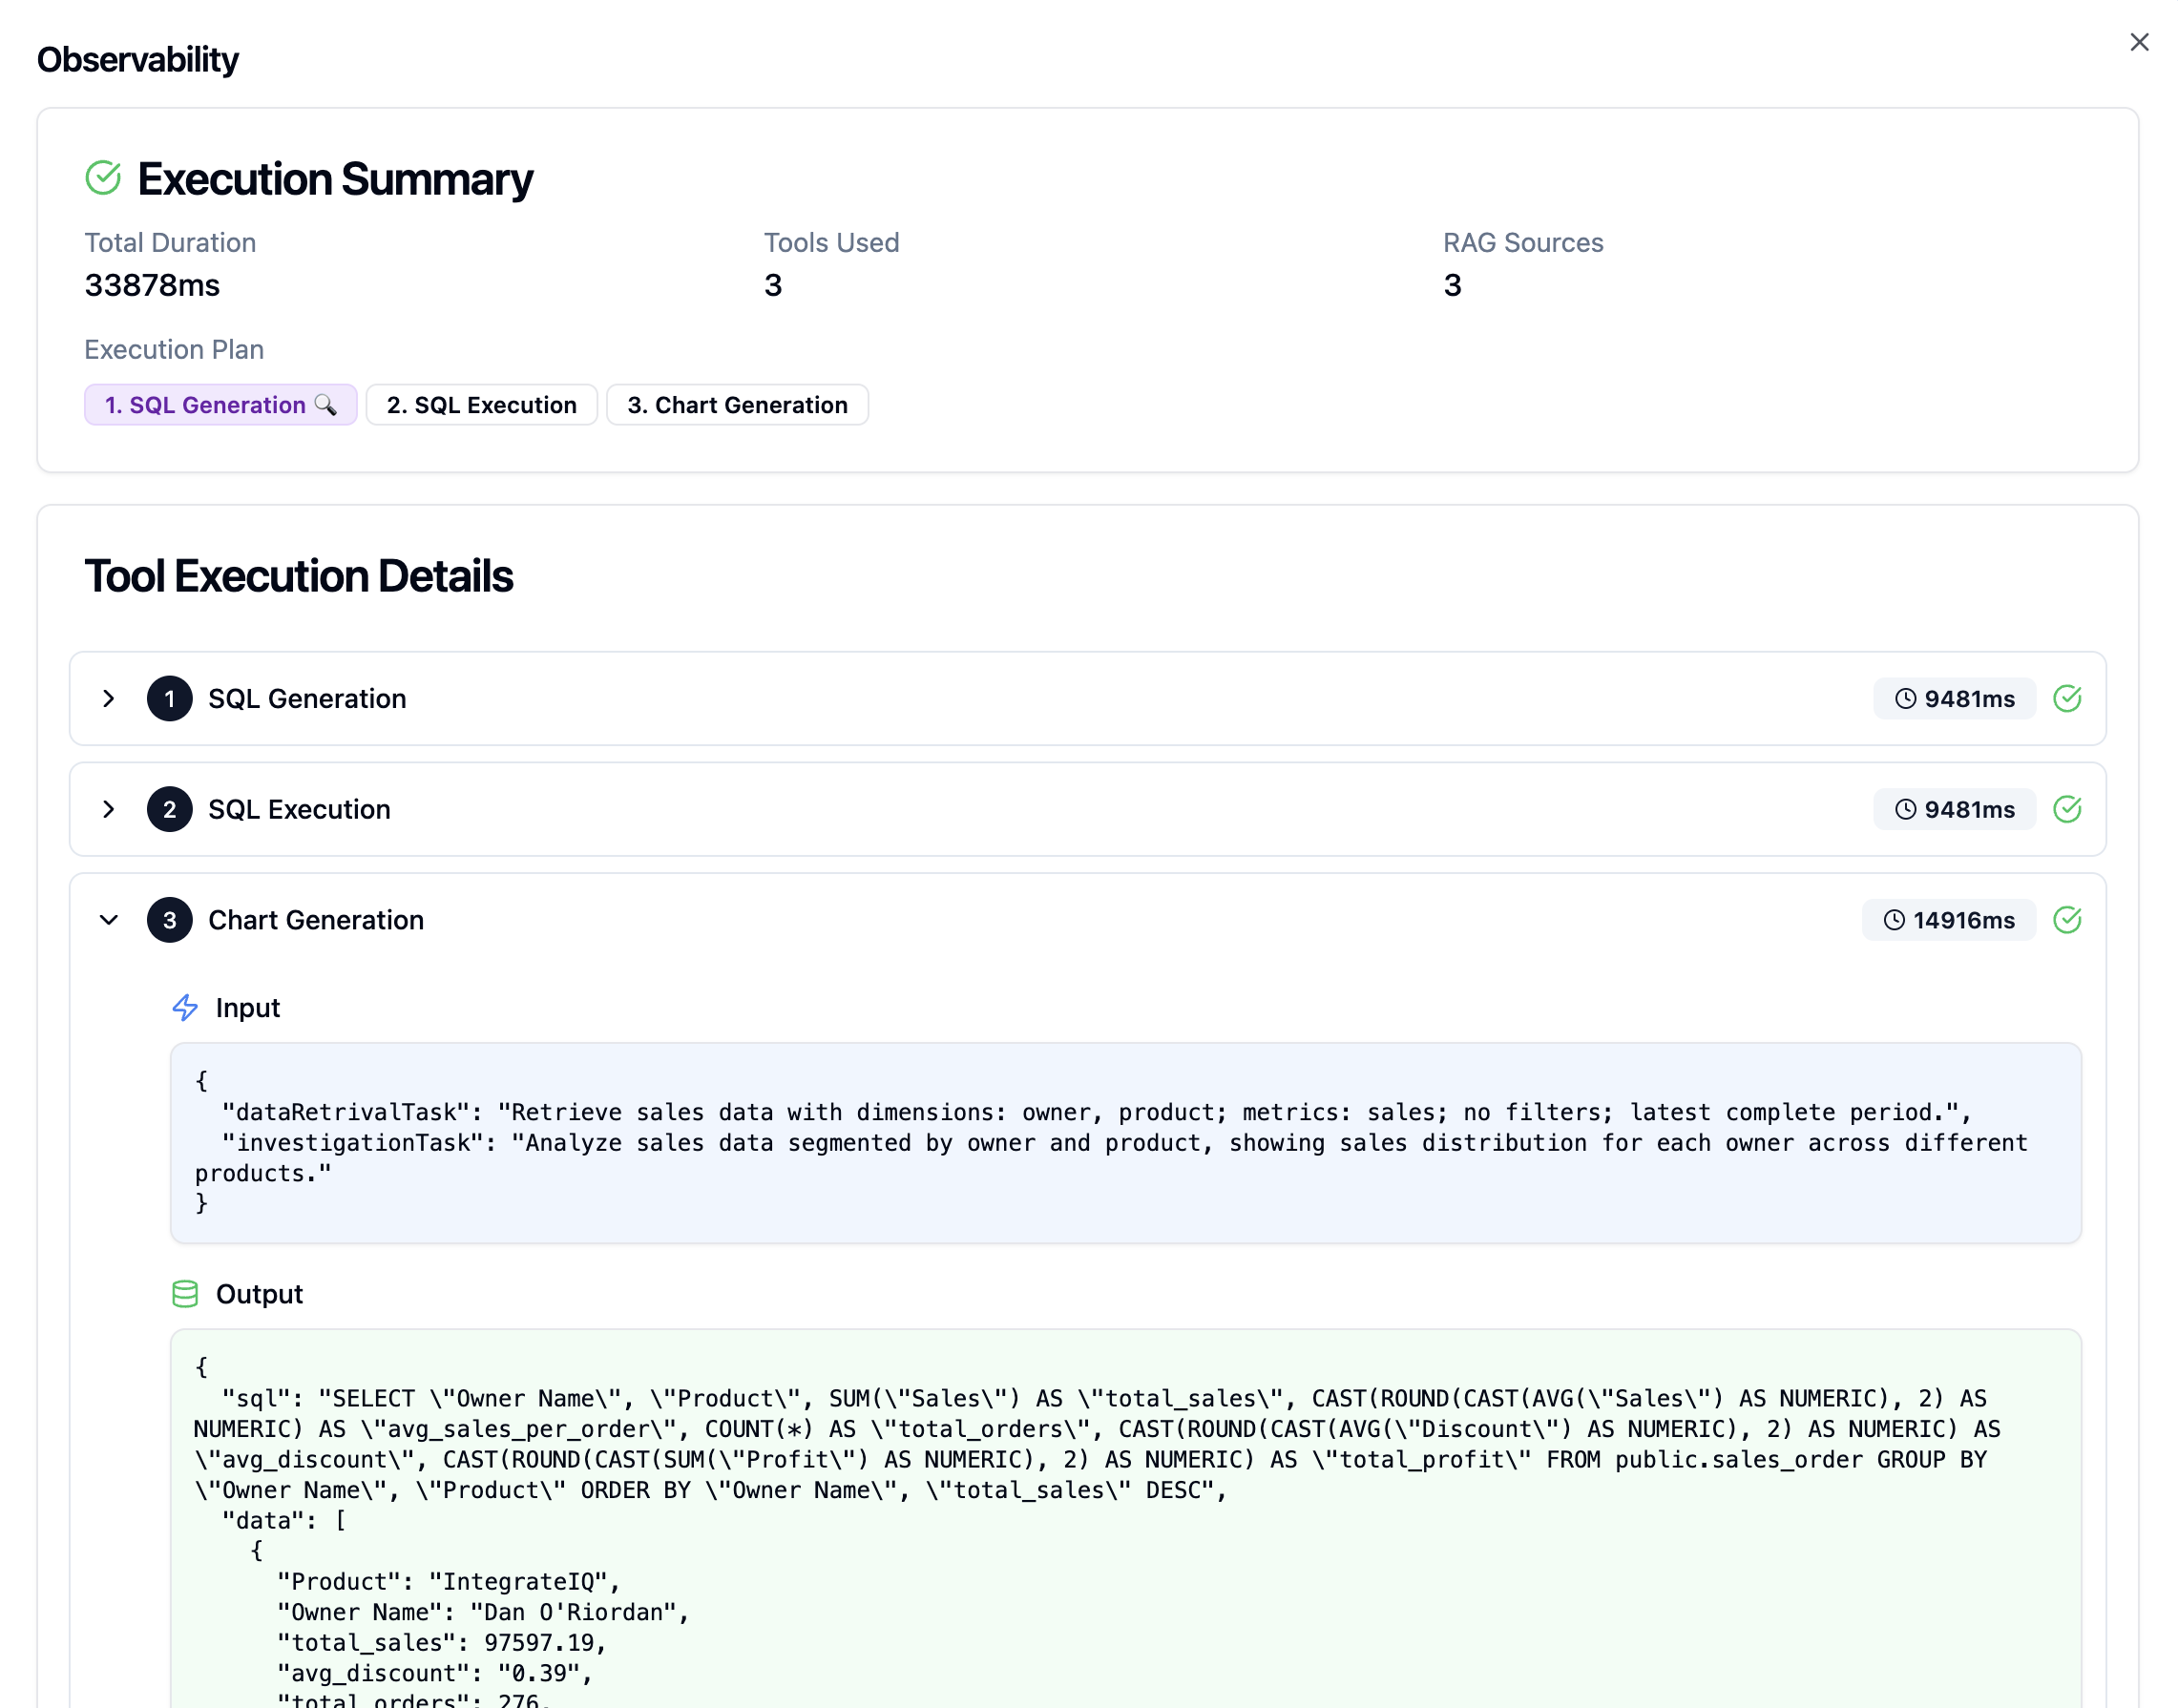 **Execution Summary** — A top-level overview: total duration, number of tools called, and RAG sources retrieved. This gives you a quick sense of whether the agent is operating efficiently or burning extra steps.
**Execution Plan** — The sequence of high-level steps the agent took, such as *SQL Generation → SQL Execution → Chart Generation*. The plan tells you which tools were involved and in what order.
**Tool Execution Details** — A step-by-step breakdown of every tool call, each with its own timing, inputs, and outputs. Expand any step to see exactly what the agent passed in and what came back:
* **SQL Generation** — The exact query written, including all joins, filters, and aggregations. If the answer is numerically wrong, this is the first place to look.
* **SQL Execution** — The raw data returned from your database before the agent interpreted it.
* **Chart Generation** — The chart type, axis mappings, and formatting settings selected. If the visualization rendered incorrectly, the config will tell you what the agent chose and why.
## Using traces to improve your agent
Observability is most useful as a diagnostic tool when the agent produces an unexpected result. A few common patterns:
**Wrong SQL, right-sounding answer** — The agent generated plausible SQL that doesn't correctly implement your business logic. The fix is usually a more precise [System Prompt](/ai-agent-builder/system-prompts) rule or a [Golden Query](/ai-agent-builder/golden-assets) demonstrating the correct approach.
**No RAG sources retrieved for a common question** — The agent answered from scratch instead of referencing a validated example. Check whether you have a Golden Query covering this pattern, and whether the question phrasing is semantically close enough to trigger retrieval.
**Correct SQL, wrong chart** — The data was right but the visualization was misleading. Add a [Golden Chart](/ai-agent-builder/golden-assets) for this question type to teach the agent the correct format.
**Slow execution with redundant steps** — The trace shows multiple SQL attempts before arriving at a correct result, which typically means the data model annotations or system prompt need more specificity.
Observability traces are available for all agent responses, including those from deployed end users. Access these through [Chat History](/ai-agent-builder/chat-history) with **Show Details** toggled on.
## Next steps
Browse past conversations and access observability traces for any deployed chat.
Add example queries and charts to fix patterns you identify in traces.
**Execution Summary** — A top-level overview: total duration, number of tools called, and RAG sources retrieved. This gives you a quick sense of whether the agent is operating efficiently or burning extra steps.
**Execution Plan** — The sequence of high-level steps the agent took, such as *SQL Generation → SQL Execution → Chart Generation*. The plan tells you which tools were involved and in what order.
**Tool Execution Details** — A step-by-step breakdown of every tool call, each with its own timing, inputs, and outputs. Expand any step to see exactly what the agent passed in and what came back:
* **SQL Generation** — The exact query written, including all joins, filters, and aggregations. If the answer is numerically wrong, this is the first place to look.
* **SQL Execution** — The raw data returned from your database before the agent interpreted it.
* **Chart Generation** — The chart type, axis mappings, and formatting settings selected. If the visualization rendered incorrectly, the config will tell you what the agent chose and why.
## Using traces to improve your agent
Observability is most useful as a diagnostic tool when the agent produces an unexpected result. A few common patterns:
**Wrong SQL, right-sounding answer** — The agent generated plausible SQL that doesn't correctly implement your business logic. The fix is usually a more precise [System Prompt](/ai-agent-builder/system-prompts) rule or a [Golden Query](/ai-agent-builder/golden-assets) demonstrating the correct approach.
**No RAG sources retrieved for a common question** — The agent answered from scratch instead of referencing a validated example. Check whether you have a Golden Query covering this pattern, and whether the question phrasing is semantically close enough to trigger retrieval.
**Correct SQL, wrong chart** — The data was right but the visualization was misleading. Add a [Golden Chart](/ai-agent-builder/golden-assets) for this question type to teach the agent the correct format.
**Slow execution with redundant steps** — The trace shows multiple SQL attempts before arriving at a correct result, which typically means the data model annotations or system prompt need more specificity.
Observability traces are available for all agent responses, including those from deployed end users. Access these through [Chat History](/ai-agent-builder/chat-history) with **Show Details** toggled on.
## Next steps
Browse past conversations and access observability traces for any deployed chat.
Add example queries and charts to fix patterns you identify in traces.