> ## Documentation Index
> Fetch the complete documentation index at: https://docs.upsolve.ai/llms.txt
> Use this file to discover all available pages before exploring further.
# Point-and-Click Interface
> Build charts in just a few clicks
You can use the point-and-click interface to edit [a newly created chart](/charts/create-chart) or an existing chart.
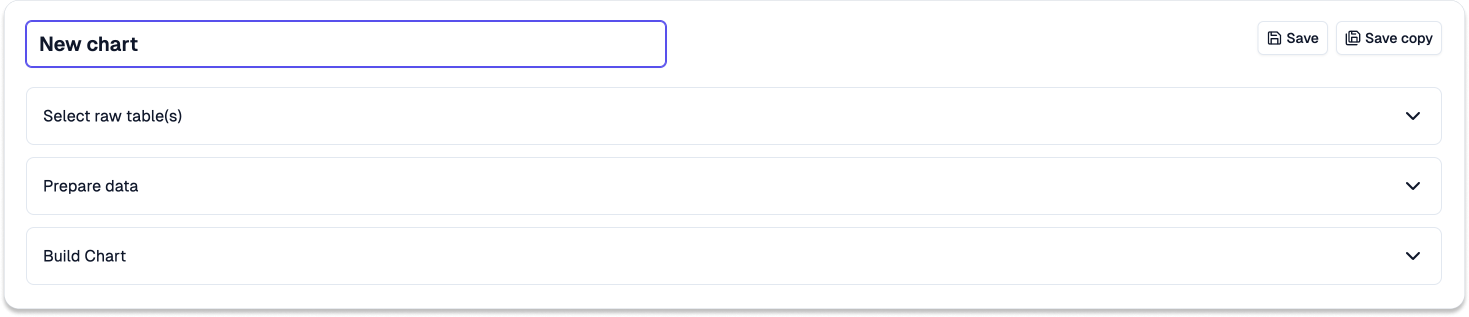 ## Building a Chart via Point and Click
It requires four steps to build a chart:
Search and select the relevant raw table(s) needed for visulizing data in your chart.
## Building a Chart via Point and Click
It requires four steps to build a chart:
Search and select the relevant raw table(s) needed for visulizing data in your chart.
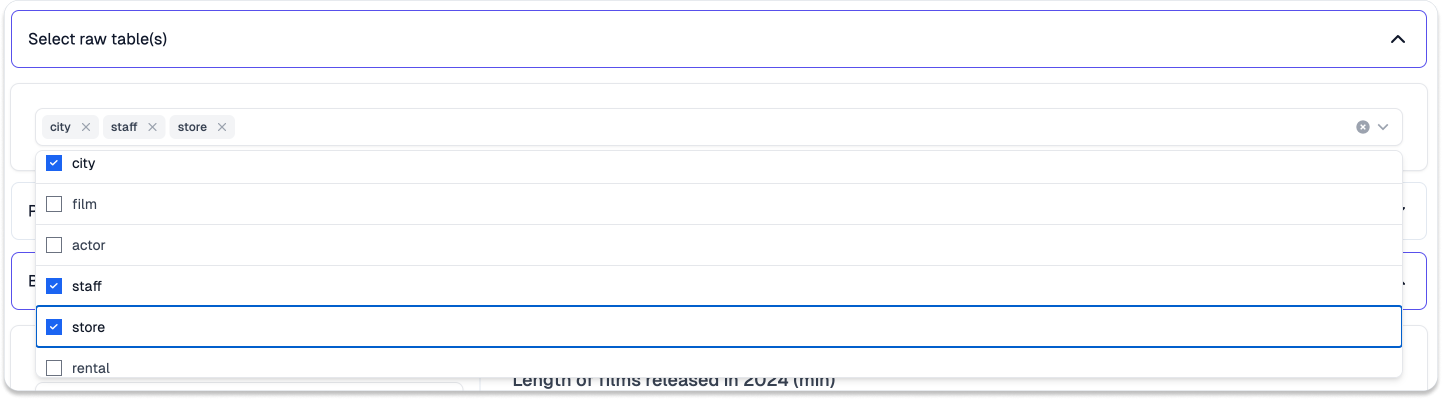 The list of available raw table(s) is generated after the [data connection](/data-connection/data-connection) is set up and metadata is computed.
{" "}
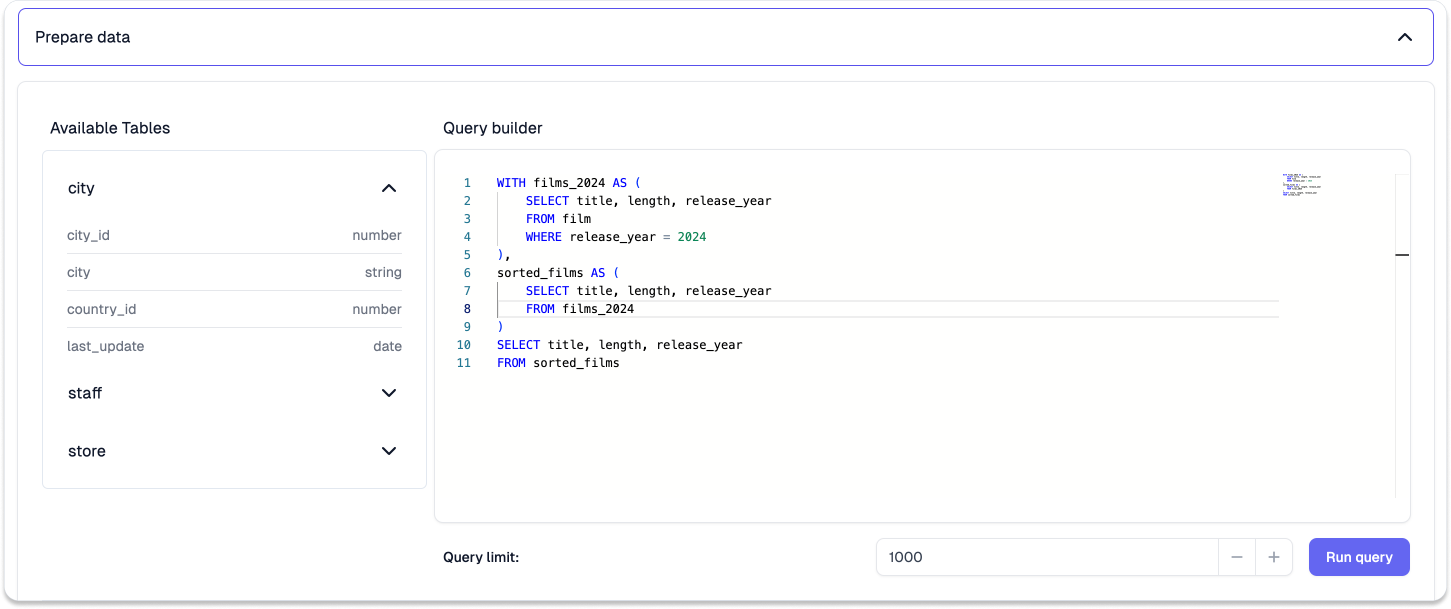
Input the relevant SQL to prepare the raw data for data visulization and click
**Run query** to execute the code.
The list of available raw table(s) is generated after the [data connection](/data-connection/data-connection) is set up and metadata is computed.
{" "}
Input the relevant SQL to prepare the raw data for data visulization and click
**Run query** to execute the code.
 {" "}
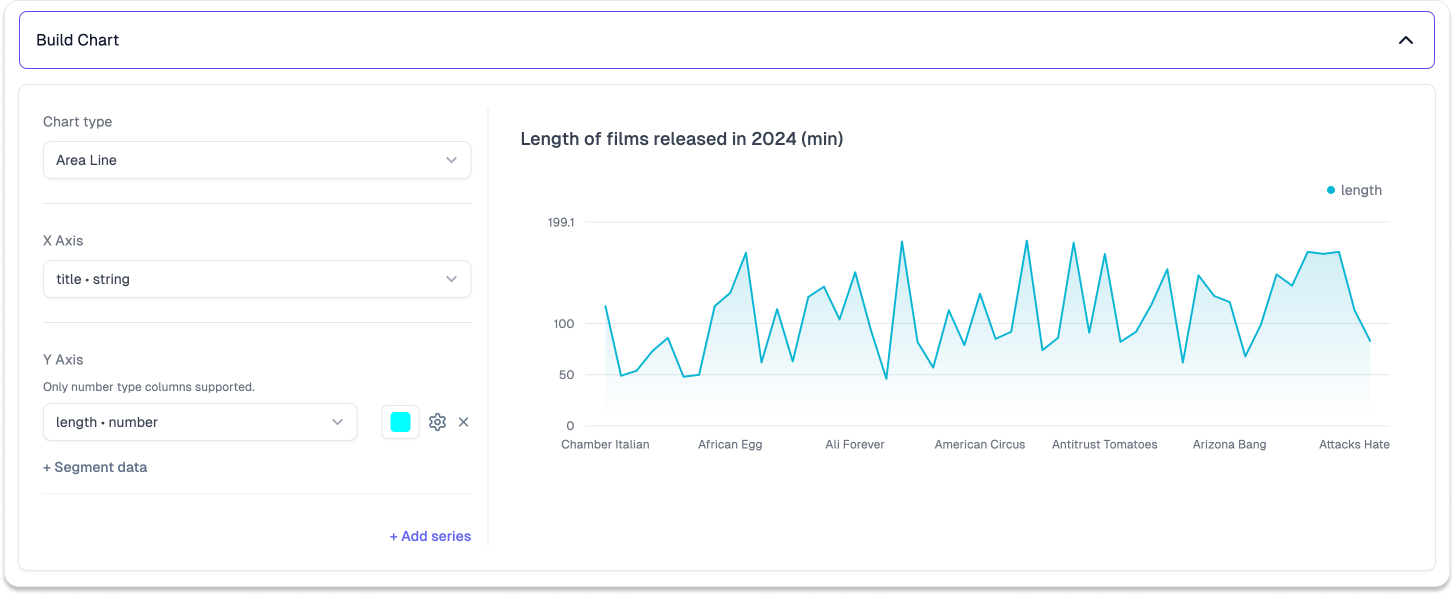
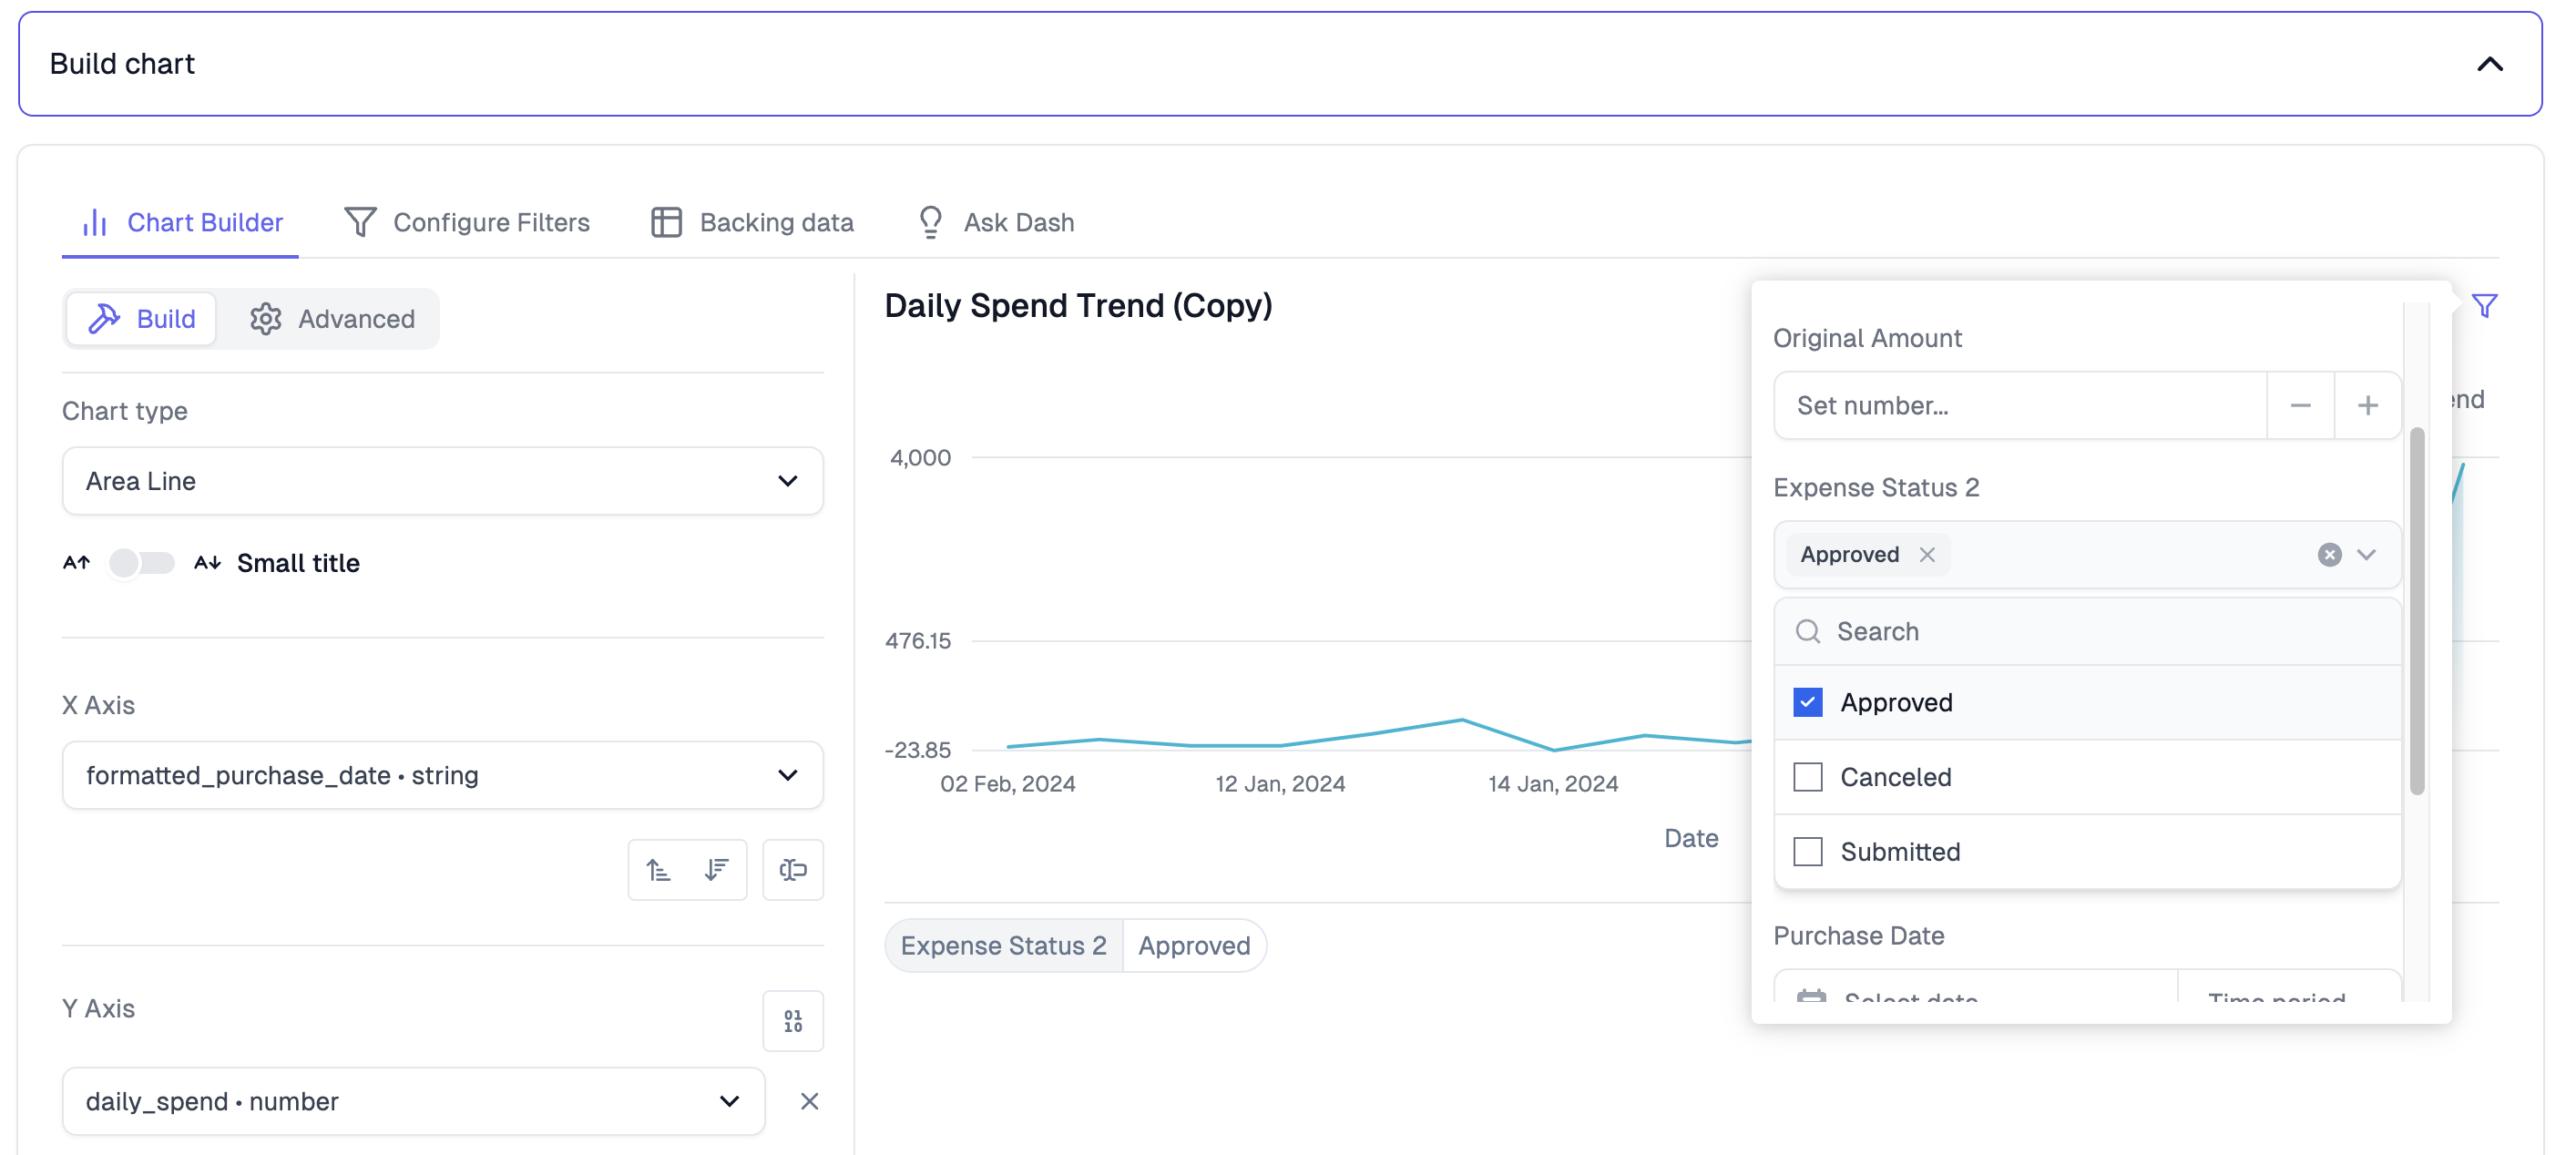
Select the relevant chart type, and choose the corresponding x- & y-axis
columns for the charting. See [Chart
Configuration](/content/charts/area-line-chart) for settings to tailor your
chart. Click **Save** when you are happy with your chart. You could also
create a copy of the chart by clicking **Save copy**.
{" "}
Select the relevant chart type, and choose the corresponding x- & y-axis
columns for the charting. See [Chart
Configuration](/content/charts/area-line-chart) for settings to tailor your
chart. Click **Save** when you are happy with your chart. You could also
create a copy of the chart by clicking **Save copy**.
 It is now possible to configure chart-level filters, for columns you expect users to interact with. For a more comprehensive overview, check out our [in-depth filtering guide](/filters/filters-in-depth).
 ## Edit an existing chart
Navigate to the **Library** application using the side navigation bar. Open the chart you want to edit by clicking it, and it will bring you to the
[**Chart Edit**](/charts/point-and-click-interface#building-a-chart-via-point-and-click) screen mentioned above.
## Edit an existing chart
Navigate to the **Library** application using the side navigation bar. Open the chart you want to edit by clicking it, and it will bring you to the
[**Chart Edit**](/charts/point-and-click-interface#building-a-chart-via-point-and-click) screen mentioned above.