> ## Documentation Index
> Fetch the complete documentation index at: https://docs.upsolve.ai/llms.txt
> Use this file to discover all available pages before exploring further.

# Bar List

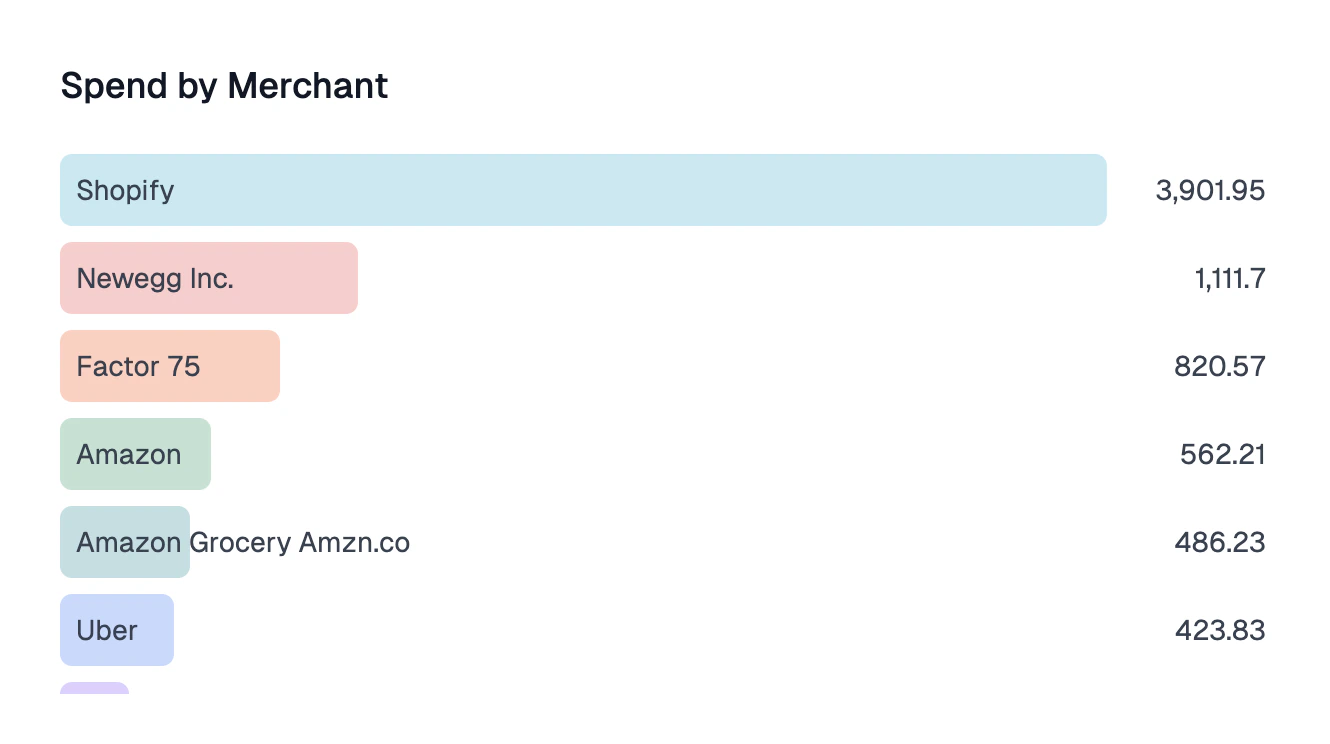
> A vertical list of horizontal bars representing data values, used to compare multiple items' magnitudes visually
<Frame>
  <img className="block dark:hidden" src="https://mintcdn.com/upsolve/t8h5CoPsK71szab3/images/content/charts/bar-list-light.png?fit=max&auto=format&n=t8h5CoPsK71szab3&q=85&s=f105565eb190e438ccf73b3cb70a2bf0" width="1330" height="744" data-path="images/content/charts/bar-list-light.png" />

  <img className="hidden dark:block" src="https://mintcdn.com/upsolve/t8h5CoPsK71szab3/images/content/charts/bar-list-dark.png?fit=max&auto=format&n=t8h5CoPsK71szab3&q=85&s=69ea96caf8b73e883f33bcb64d8f64d3" width="1334" height="752" data-path="images/content/charts/bar-list-dark.png" />
</Frame>

## Configuration

<ResponseField name="X-Axis" type="string or numeric" required>
  Category to group the list by
</ResponseField>

<ResponseField name="Y-Axis" type="numeric" required>
  Column to aggregate the chart on
</ResponseField>
