> ## Documentation Index
> Fetch the complete documentation index at: https://docs.upsolve.ai/llms.txt
> Use this file to discover all available pages before exploring further.
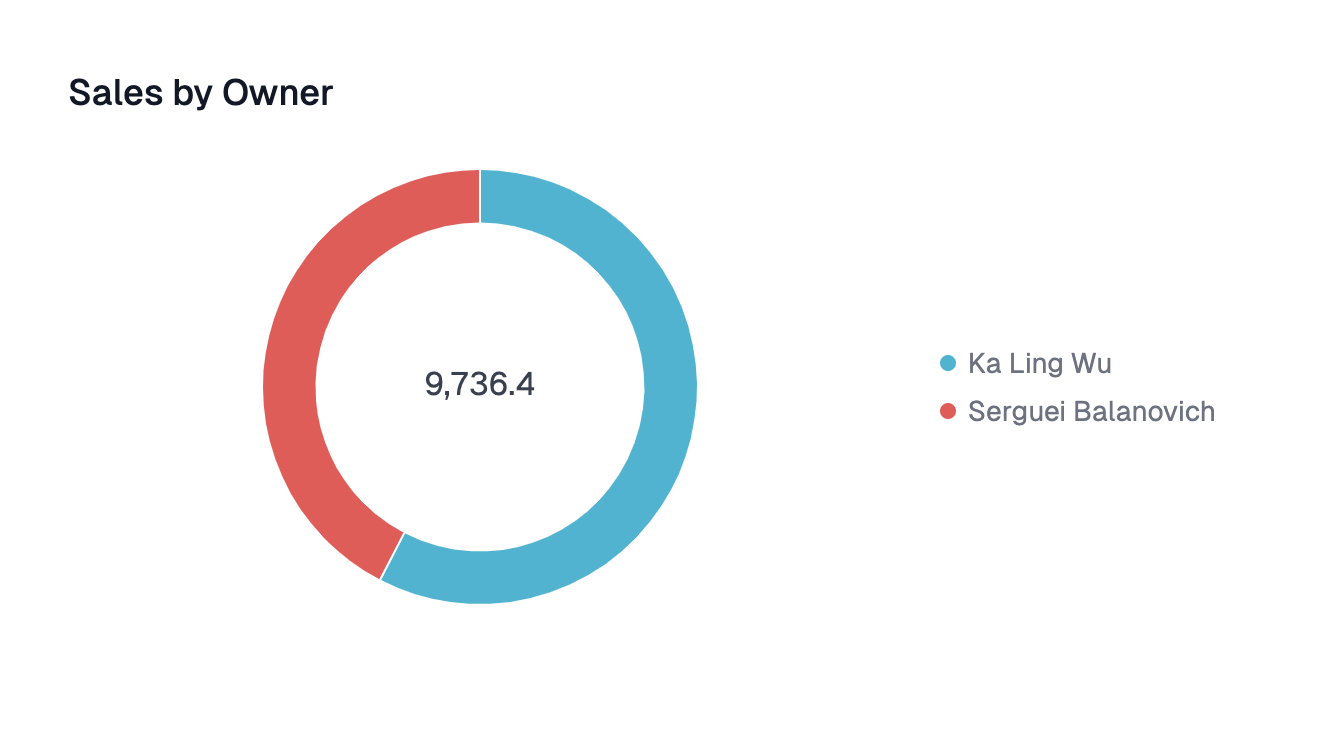
# Donut Chart
> Shows proportional data and the relative sizes of parts to a whole as a circular graph with a blank center
 ## Configuration
Category to group the chart by
If there are more than 25 unique categories, all remaining categories will be grouped under **"Other."**
Column to aggregate the chart on
## Configuration
Category to group the chart by
If there are more than 25 unique categories, all remaining categories will be grouped under **"Other."**
Column to aggregate the chart on