> ## Documentation Index
> Fetch the complete documentation index at: https://docs.upsolve.ai/llms.txt
> Use this file to discover all available pages before exploring further.

# Stacked Bar Chart

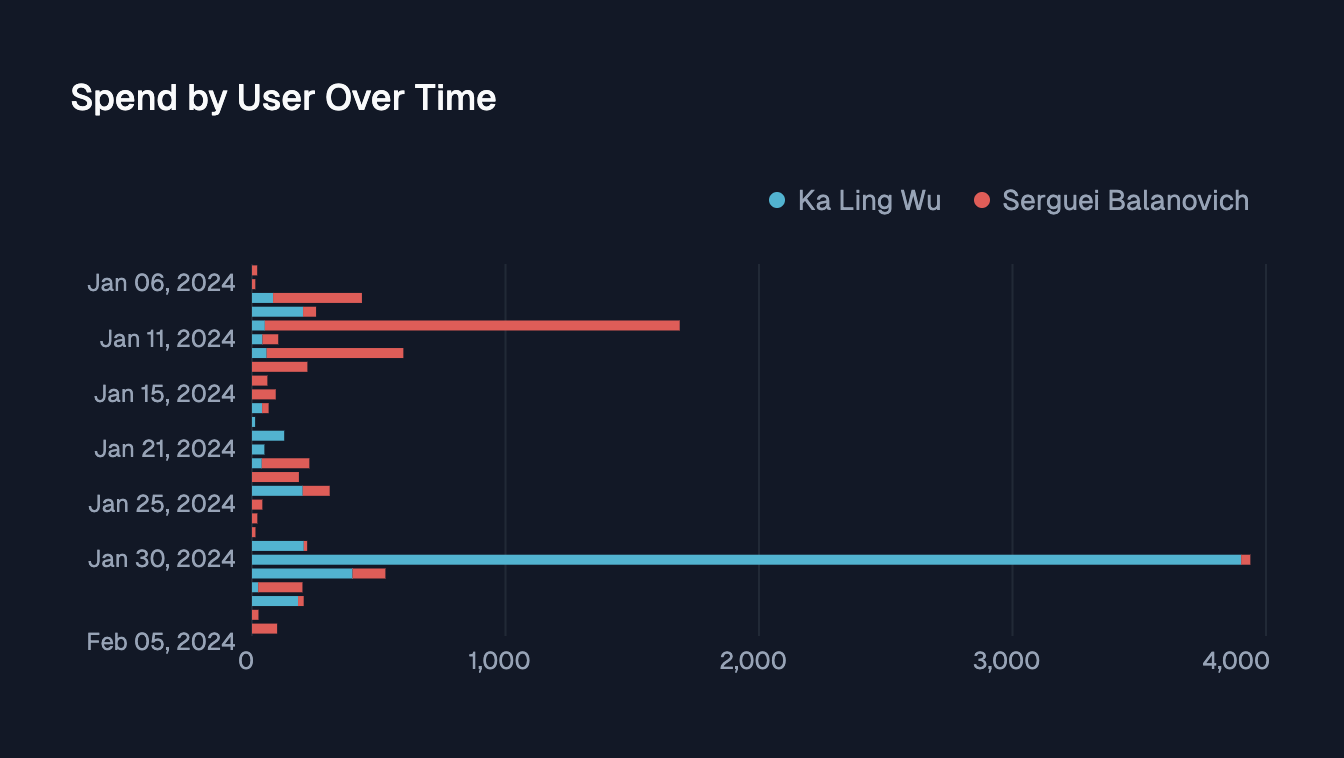
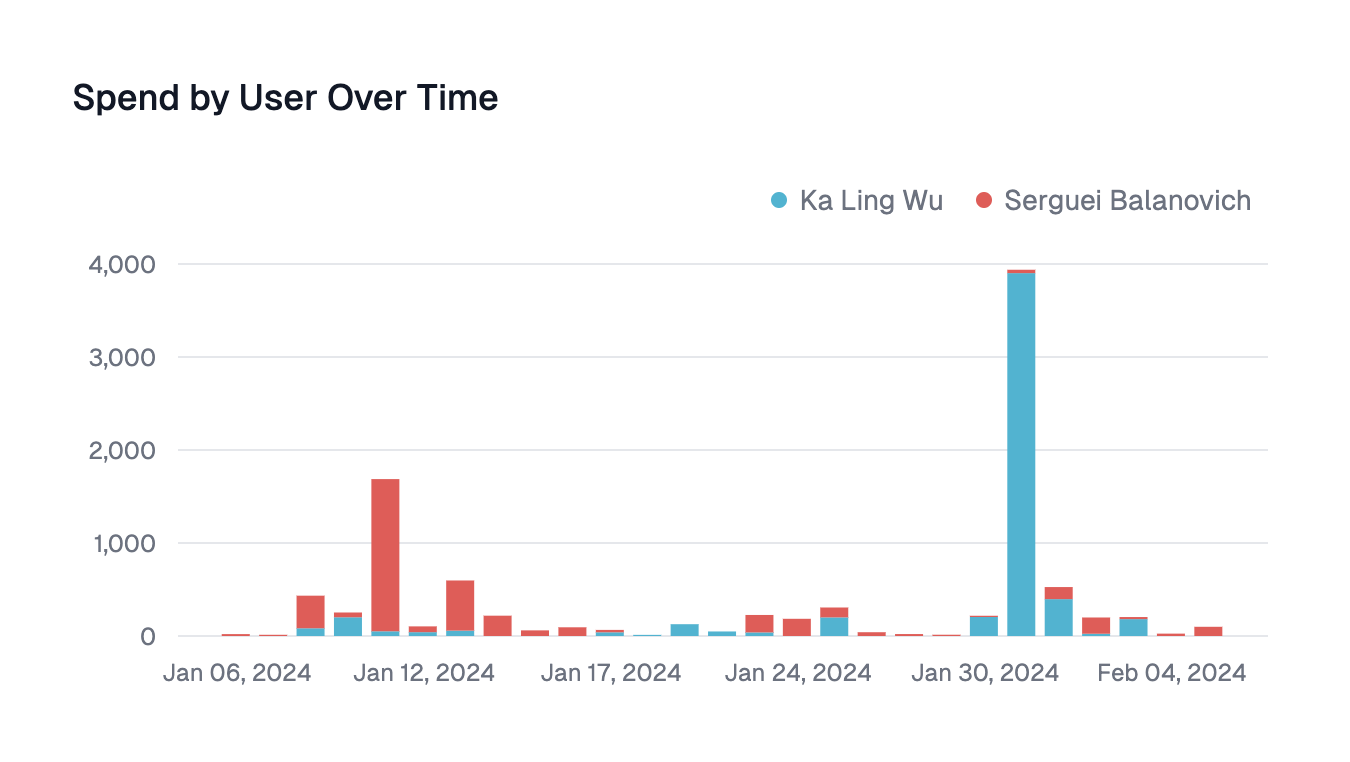
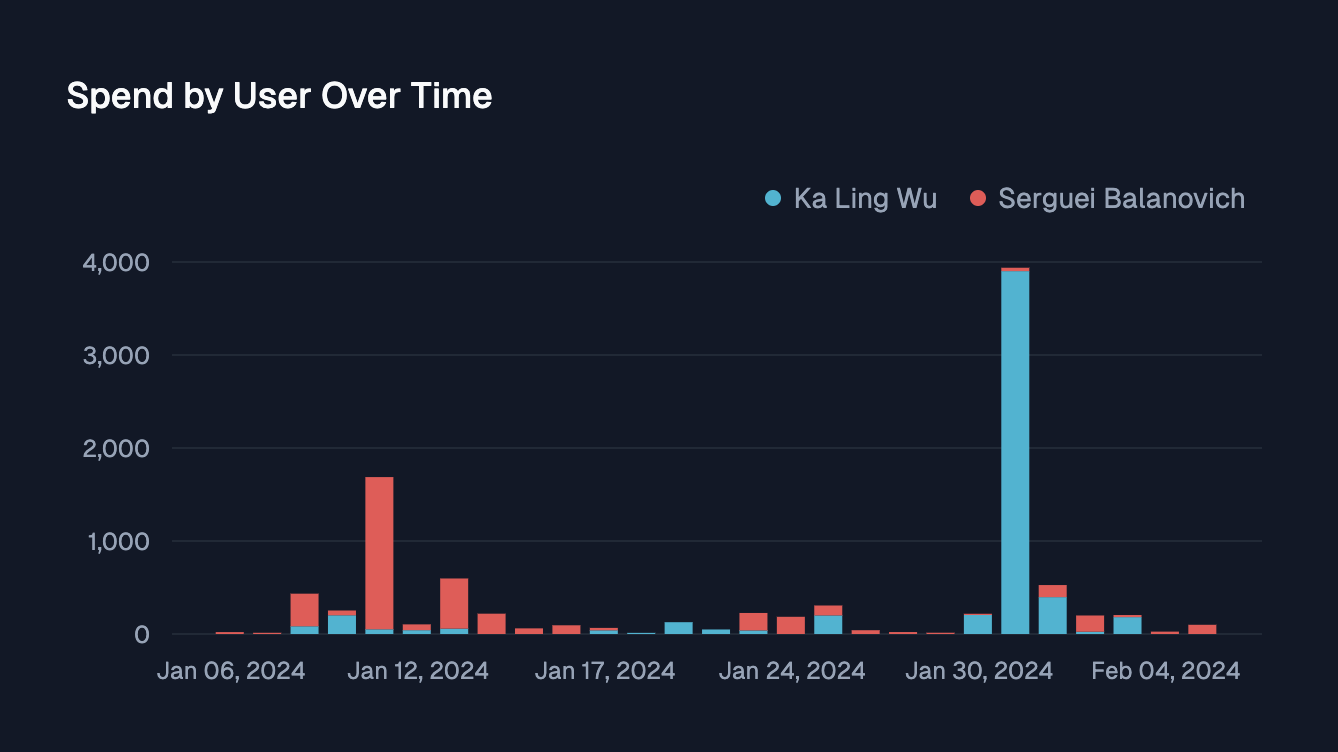
> Displays single or multiple categories of data within each group stacked on top of each other for easy comparison across different groups
<Frame>
  <img className="block dark:hidden" src="https://mintcdn.com/upsolve/K_3XAKoFAbXHl92p/images/content/charts/stacked-bar-chart-light.png?fit=max&auto=format&n=K_3XAKoFAbXHl92p&q=85&s=70efd04f7c8cfba9de5fa5c2f7779196" width="1350" height="762" data-path="images/content/charts/stacked-bar-chart-light.png" />

  <img className="hidden dark:block" src="https://mintcdn.com/upsolve/K_3XAKoFAbXHl92p/images/content/charts/stacked-bar-chart-dark.png?fit=max&auto=format&n=K_3XAKoFAbXHl92p&q=85&s=3d9db4894a622f8f3fc3e10609034447" width="1338" height="752" data-path="images/content/charts/stacked-bar-chart-dark.png" />
</Frame>

## Configuration

<ResponseField name="X-Axis" type="string or numeric" required>
  Category to group the chart by
</ResponseField>

<ResponseField name="Y-Axis" type="numeric" required>
  Column to aggregate the bar chart on. You could select multiple columns by **Add Series**
</ResponseField>

<ResponseField name="Segment by">
  Divides series into meaningful subgroups. The data in each subgroups can then be aggregated via one of `Distinct count`, `Count`, `Sub`, `Average`, `Min`, `Max`
</ResponseField>

<ResponseField name="Direction">
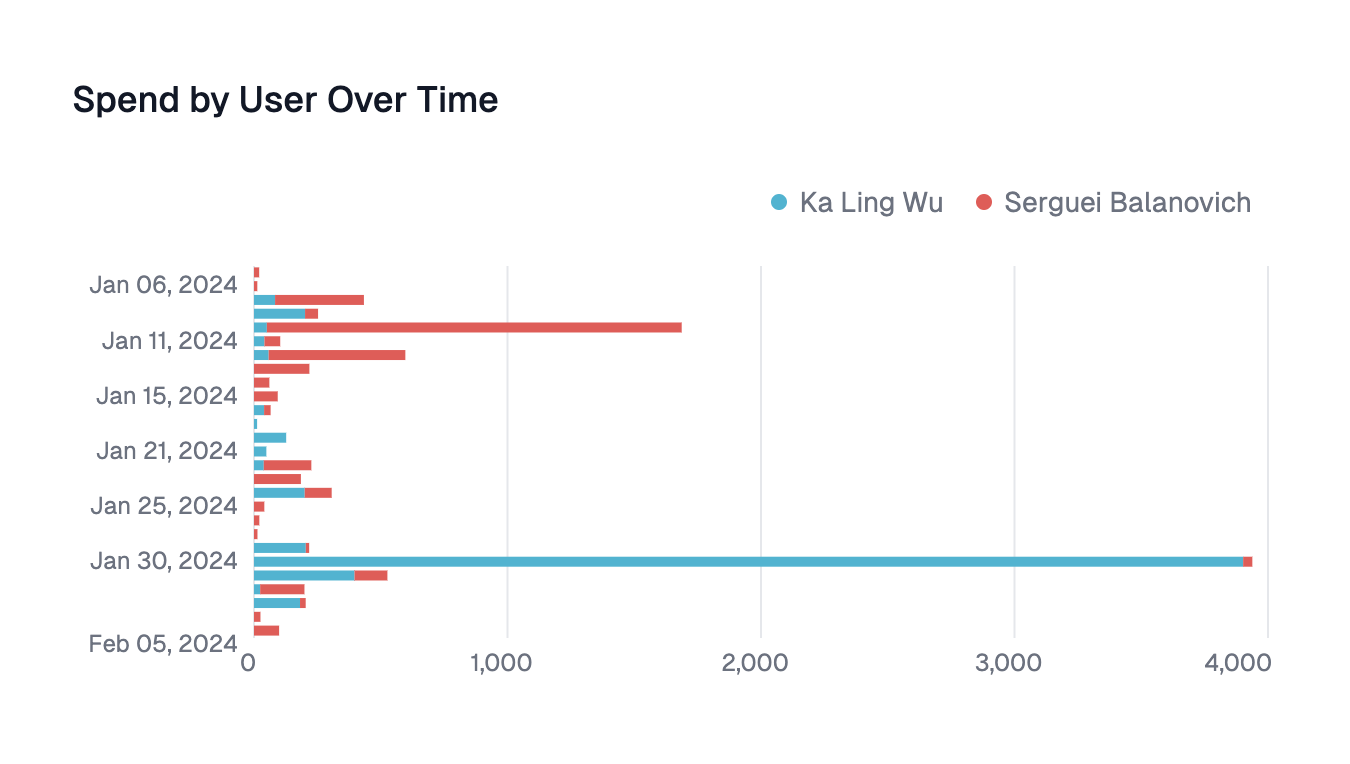
  The direction of bars could be set as `vertical` or `horizontal`
</ResponseField>

<Frame>
  <img className="block dark:hidden" src="https://mintcdn.com/upsolve/K_3XAKoFAbXHl92p/images/content/charts/stacked-horizontal-bar-chart-light.png?fit=max&auto=format&n=K_3XAKoFAbXHl92p&q=85&s=1b7fb62260901bcc3ffc8a2acdc8c891" width="1350" height="764" data-path="images/content/charts/stacked-horizontal-bar-chart-light.png" />

  <img className="hidden dark:block" src="https://mintcdn.com/upsolve/K_3XAKoFAbXHl92p/images/content/charts/stacked-horizontal-bar-chart-dark.png?fit=max&auto=format&n=K_3XAKoFAbXHl92p&q=85&s=185928518a21010710340a66842519ad" width="1344" height="758" data-path="images/content/charts/stacked-horizontal-bar-chart-dark.png" />
</Frame>