> ## Documentation Index
> Fetch the complete documentation index at: https://docs.upsolve.ai/llms.txt
> Use this file to discover all available pages before exploring further.
# JSON Column Parsing
> Automatically expand nested JSON columns into individual fields for charts and filters.
## Overview
Many databases store semi-structured data in JSON columns. JSON Column Parsing lets you expand these nested fields into separate, queryable columns - no ETL pipeline needed. Once activated, JSON properties appear as individual columns in your charts and filters.
**Before:** A single `metadata` column containing `{"region": "US", "plan": "pro", "mrr": 450}`
**After:** Three separate columns - `metadata.region`, `metadata.plan`, `metadata.mrr` - each usable in axes, filters, and groupings.
### Supported Databases
JSON parsing works with **Postgres**, **BigQuery**, **ClickHouse**, and databases connected via the **Data Plane**. The system generates the correct JSON extraction syntax for each database type automatically.
## Step 1: Recompute Connection Metadata
Before enabling JSON parsing, make sure your connection metadata is up to date.
1. Navigate to the **Connections** page
2. Find the connection that contains your JSON columns
3. Click **Recompute Metadata**
4. Wait for the metadata refresh to complete
 ## Step 2: Activate JSON Parsing on a Column
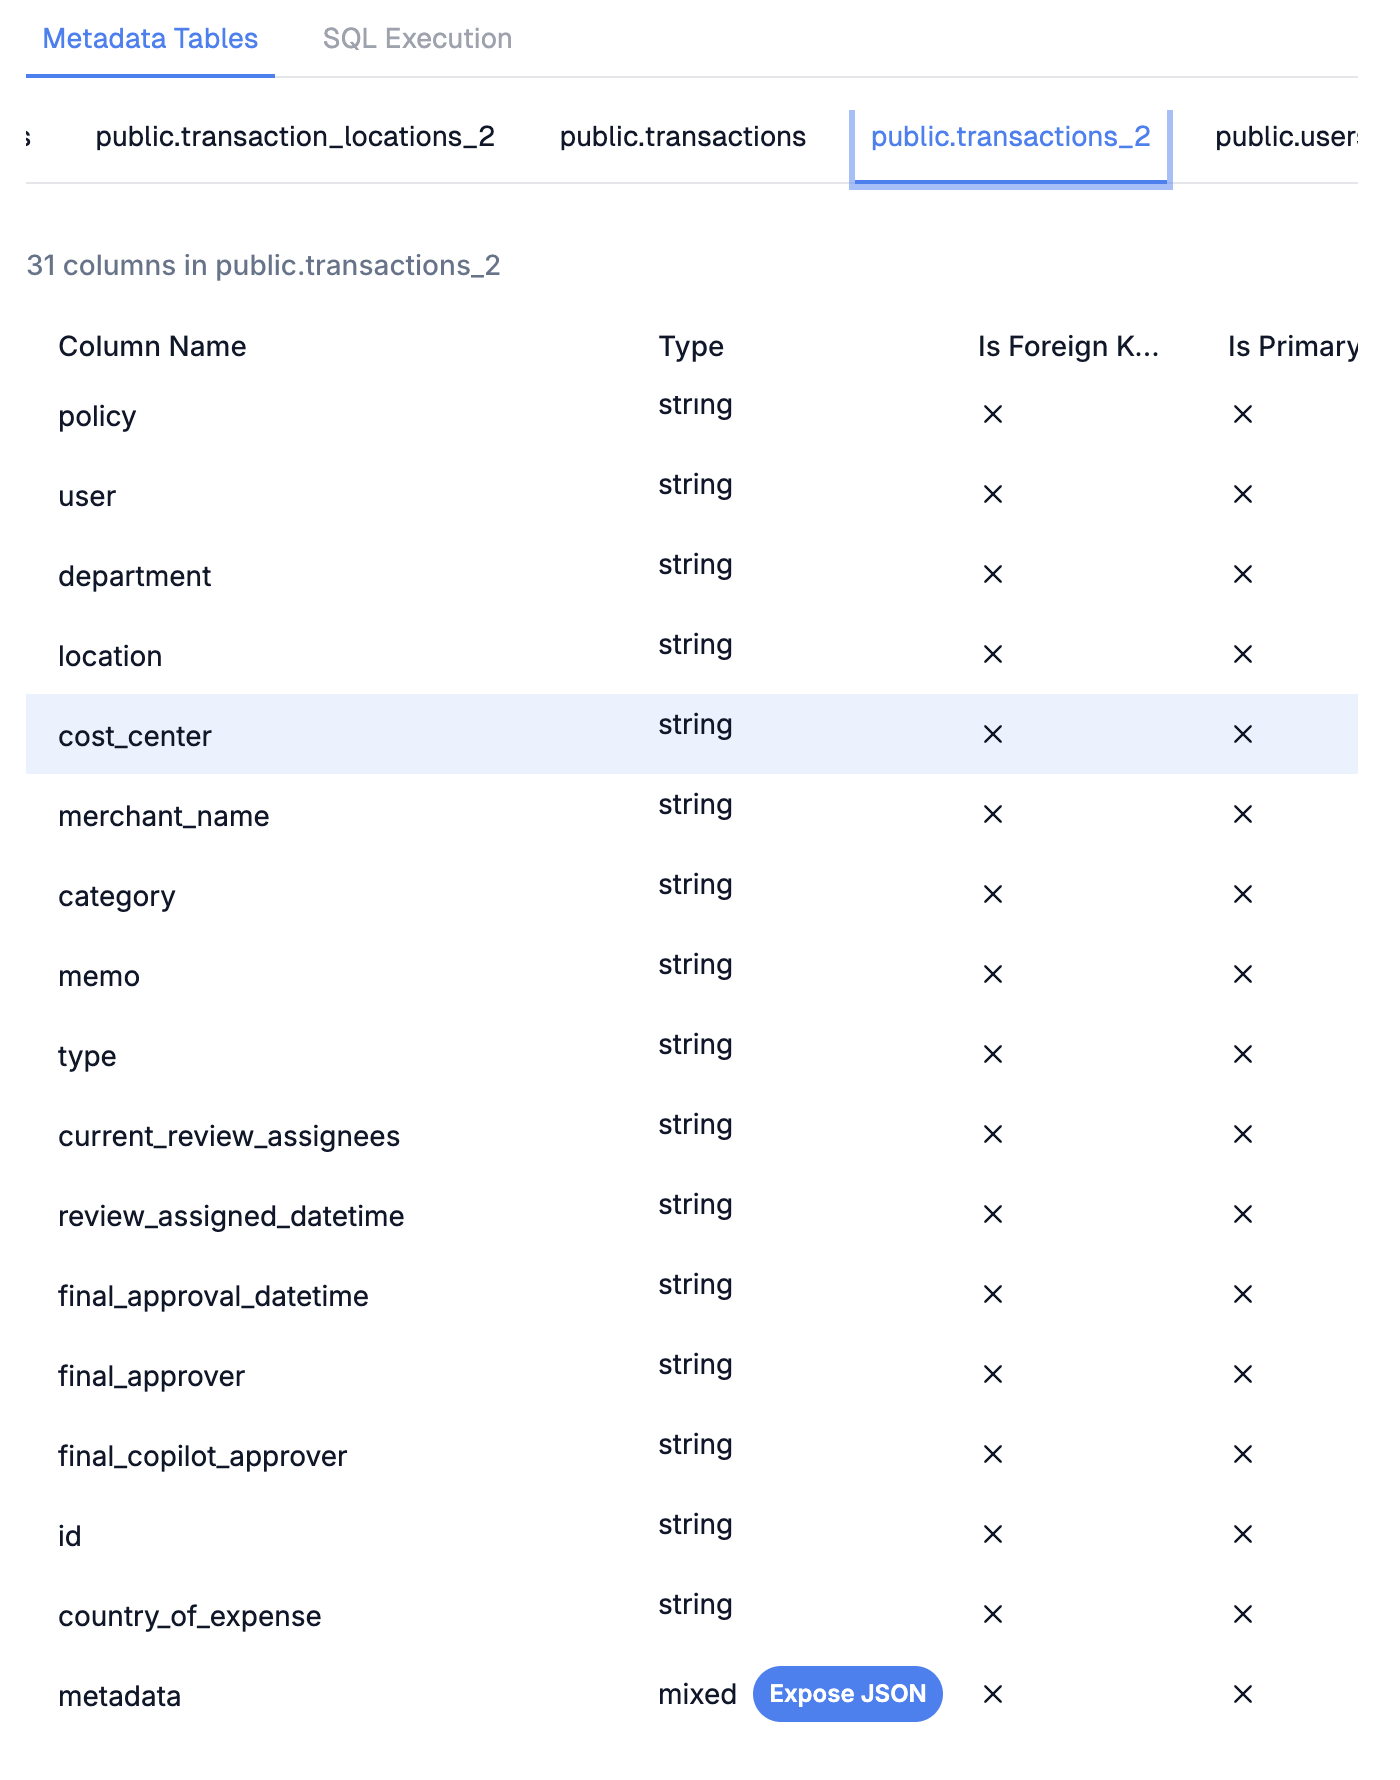
After metadata is refreshed, columns containing JSON data will show a type of `json`.
1. In the metadata viewer, select the table containing your JSON column
2. Find the column with type `json`
3. Click the **Expose JSON** button next to it
4. A success notification confirms the column is now JSON-parsed
## Step 2: Activate JSON Parsing on a Column
After metadata is refreshed, columns containing JSON data will show a type of `json`.
1. In the metadata viewer, select the table containing your JSON column
2. Find the column with type `json`
3. Click the **Expose JSON** button next to it
4. A success notification confirms the column is now JSON-parsed
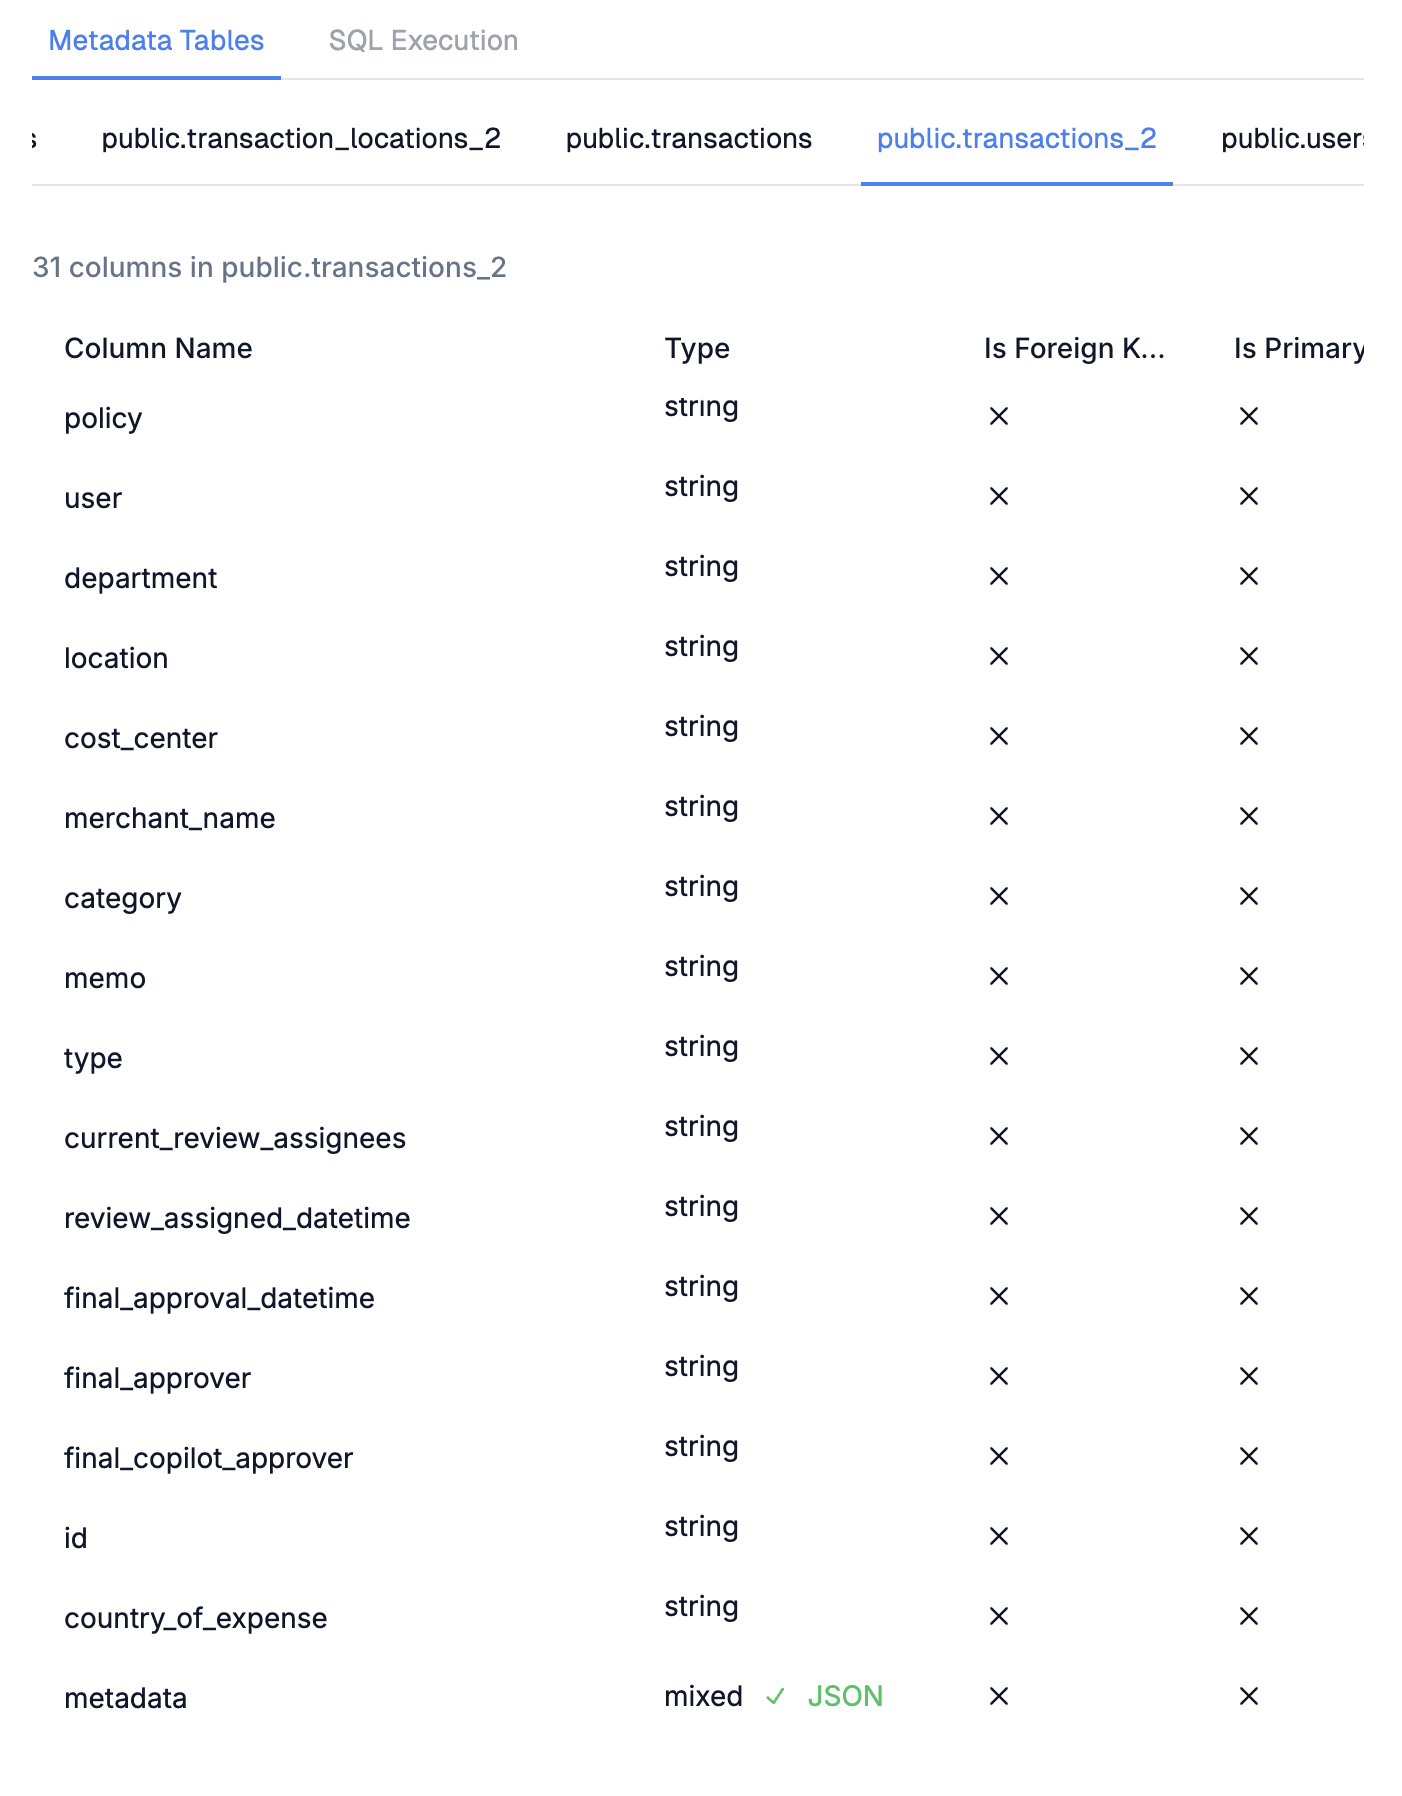
 Once activated, the button is replaced with a green checkmark and "JSON" label.
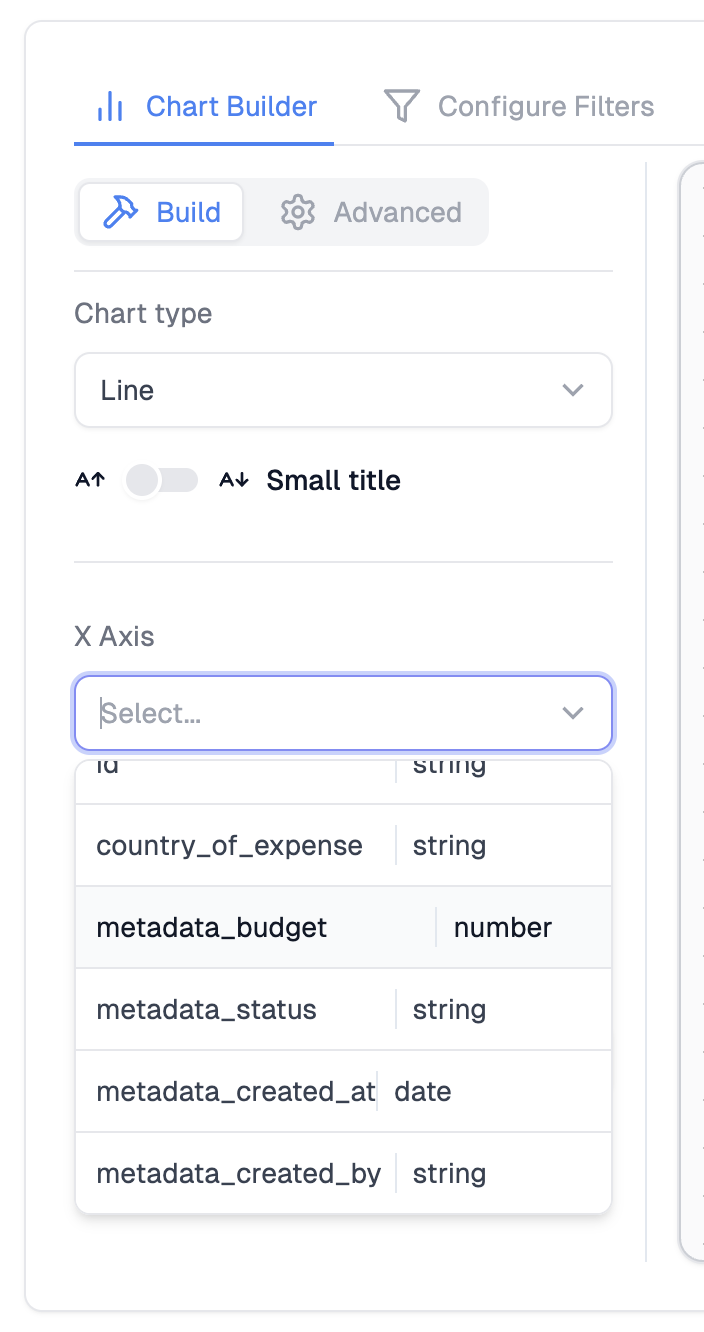
 ## Step 3: Use JSON Fields in Charts
The parsed JSON properties are now available as separate columns when building charts.
1. Go to your **Dashboard**
2. Create a new chart or edit an existing one
3. In the **Raw Tables** section, select the table with the JSON column
4. Save the chart
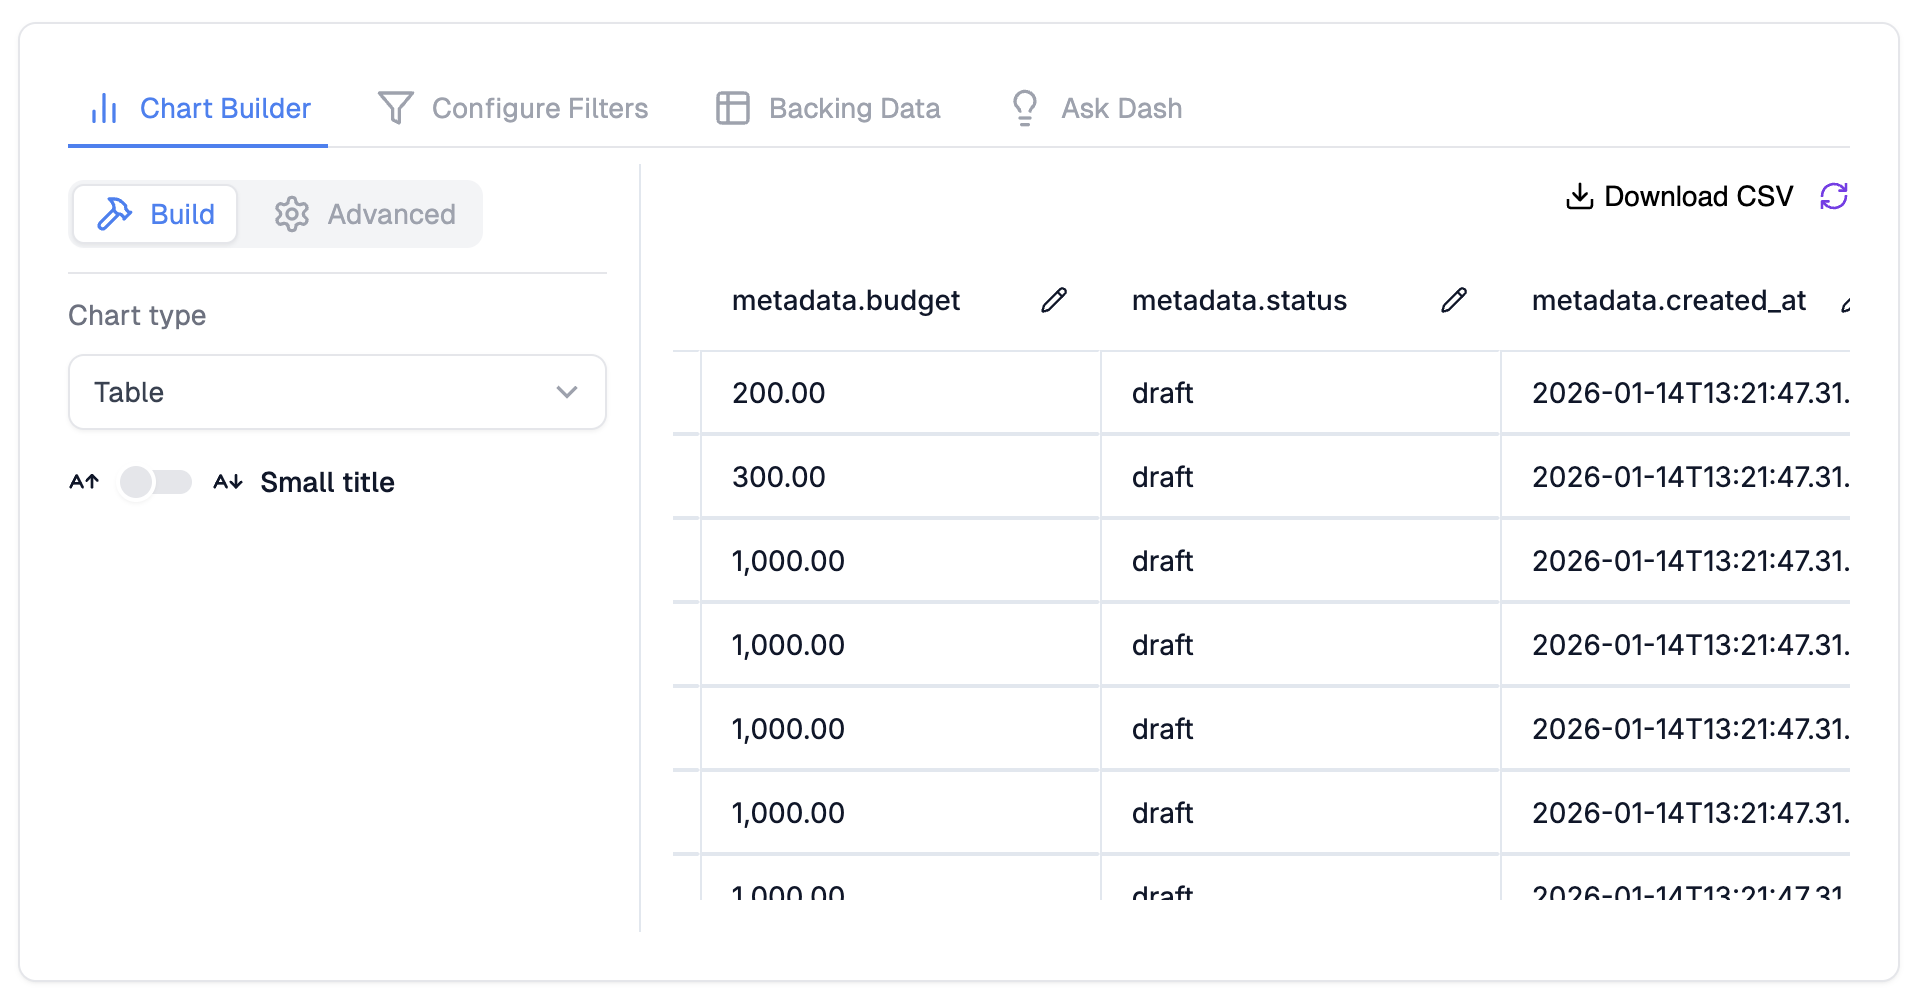
When the chart loads, all nested JSON properties appear as individual columns (e.g., `metadata.region`, `metadata.plan`).
## Step 3: Use JSON Fields in Charts
The parsed JSON properties are now available as separate columns when building charts.
1. Go to your **Dashboard**
2. Create a new chart or edit an existing one
3. In the **Raw Tables** section, select the table with the JSON column
4. Save the chart
When the chart loads, all nested JSON properties appear as individual columns (e.g., `metadata.region`, `metadata.plan`).
 You can use these expanded columns for:
* **X-Axis and Y-Axis** values
* **Group By** segmentation
* **Aggregations** (sum, count, avg on numeric JSON properties)
You can use these expanded columns for:
* **X-Axis and Y-Axis** values
* **Group By** segmentation
* **Aggregations** (sum, count, avg on numeric JSON properties)
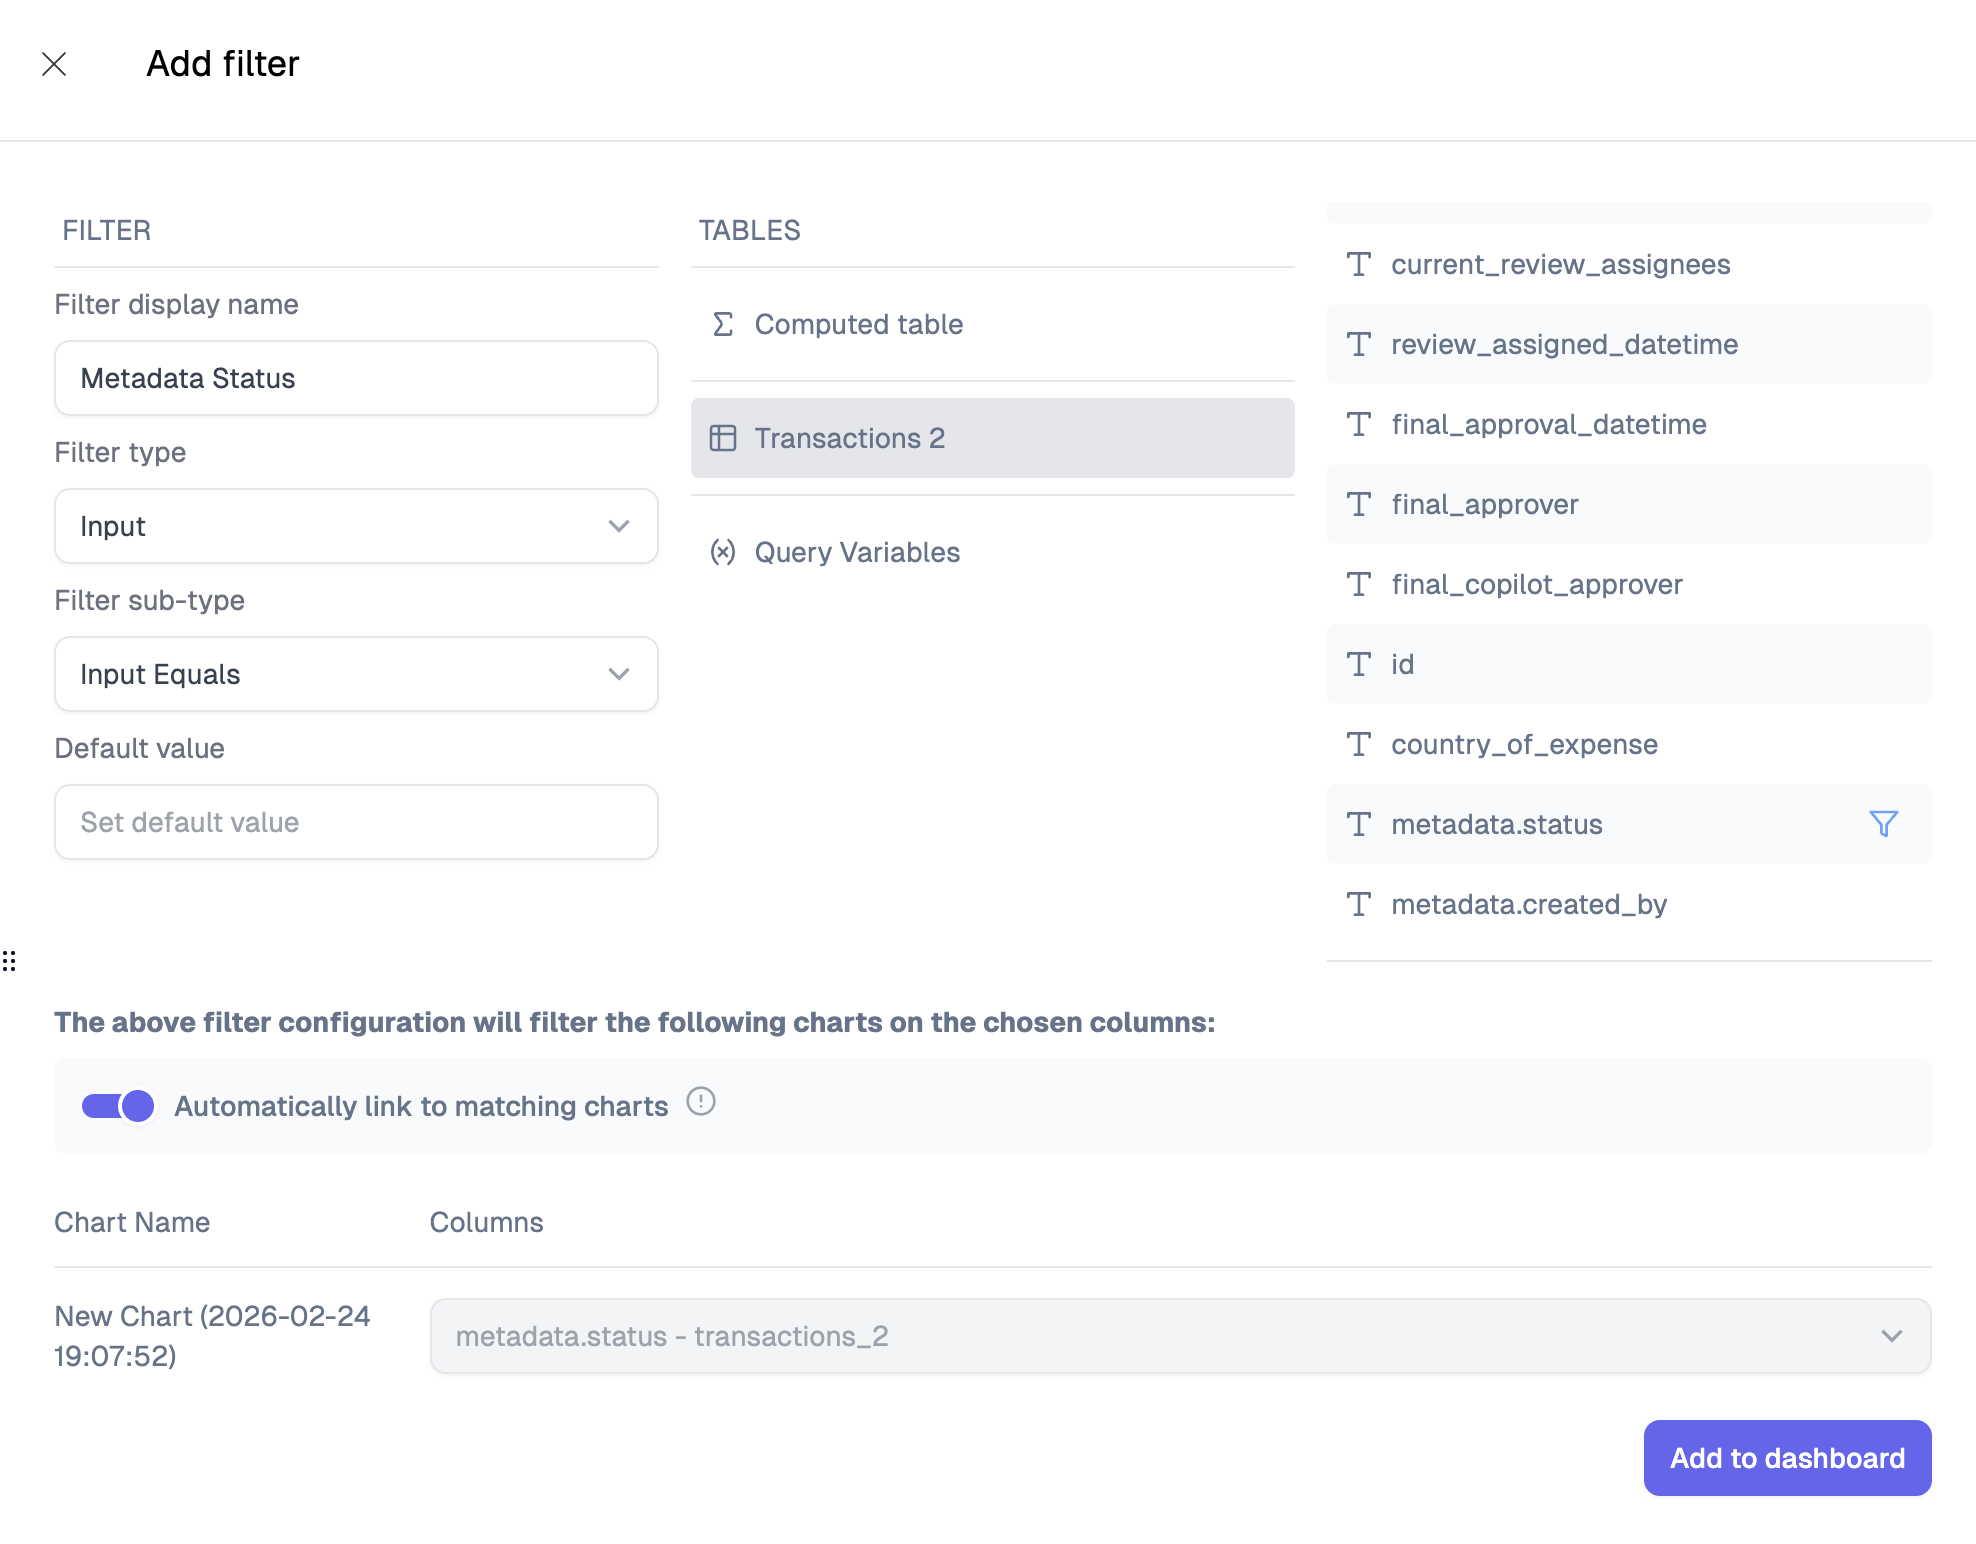
 ## Step 4: Filter by JSON Fields
Parsed JSON fields also appear in the filter panel, letting users filter dashboards by nested properties.
1. Open the **Filters** section of your dashboard or chart
2. After selecting raw tables, the nested JSON properties appear in the filter column dropdown
3. Select a JSON property to filter by (e.g., `metadata.region`)
4. Choose a filter type (equals, contains, etc.) and set the value
## Step 4: Filter by JSON Fields
Parsed JSON fields also appear in the filter panel, letting users filter dashboards by nested properties.
1. Open the **Filters** section of your dashboard or chart
2. After selecting raw tables, the nested JSON properties appear in the filter column dropdown
3. Select a JSON property to filter by (e.g., `metadata.region`)
4. Choose a filter type (equals, contains, etc.) and set the value
 All standard filter types work with JSON fields:
* **Input** filters (equals, contains, starts with)
* **Select** filters (single and multi-select)
* **Number** filters (greater than, less than, equal to) for numeric JSON properties
* **Date** filters for date-typed JSON properties
## Notes
* JSON parsing happens at query time. The original JSON column is replaced by its expanded properties in the chart's SQL query.
* If the JSON structure changes (new keys added), recompute metadata and re-save the chart to pick up new fields.
* Column names use dot notation (e.g., `metadata.region`) to indicate nesting.
* Deeply nested JSON is supported - each level is separated by dots (e.g., `metadata.address.city`).
All standard filter types work with JSON fields:
* **Input** filters (equals, contains, starts with)
* **Select** filters (single and multi-select)
* **Number** filters (greater than, less than, equal to) for numeric JSON properties
* **Date** filters for date-typed JSON properties
## Notes
* JSON parsing happens at query time. The original JSON column is replaced by its expanded properties in the chart's SQL query.
* If the JSON structure changes (new keys added), recompute metadata and re-save the chart to pick up new fields.
* Column names use dot notation (e.g., `metadata.region`) to indicate nesting.
* Deeply nested JSON is supported - each level is separated by dots (e.g., `metadata.address.city`).