> ## Documentation Index
> Fetch the complete documentation index at: https://docs.upsolve.ai/llms.txt
> Use this file to discover all available pages before exploring further.
# Filtering
> An in depth guide for setting up filters
## Overview
Dashboards in Upsolve are **source agnostic**. This means that multiple charts backed by multiple data sources may co-exist on the same dashboard. This provides endless flexibility to dashboard builders, but also requires filtering to be built on a set of rails that is different from traditional BI tools.
The basic concept is that there are [chart filters](#chart-filters) and [dashboard filters](#dashboard-filters). A **dashboard** filter can only be configured to point to one or more **chart** filters. This ensures a consistent behavior for the chart, whether it is being viewed/filtered as a standalone experience, or as part of a dashboard.
## Chart filters
To create a chart filter, go into the chart editor and select the `Configure filters` tab.
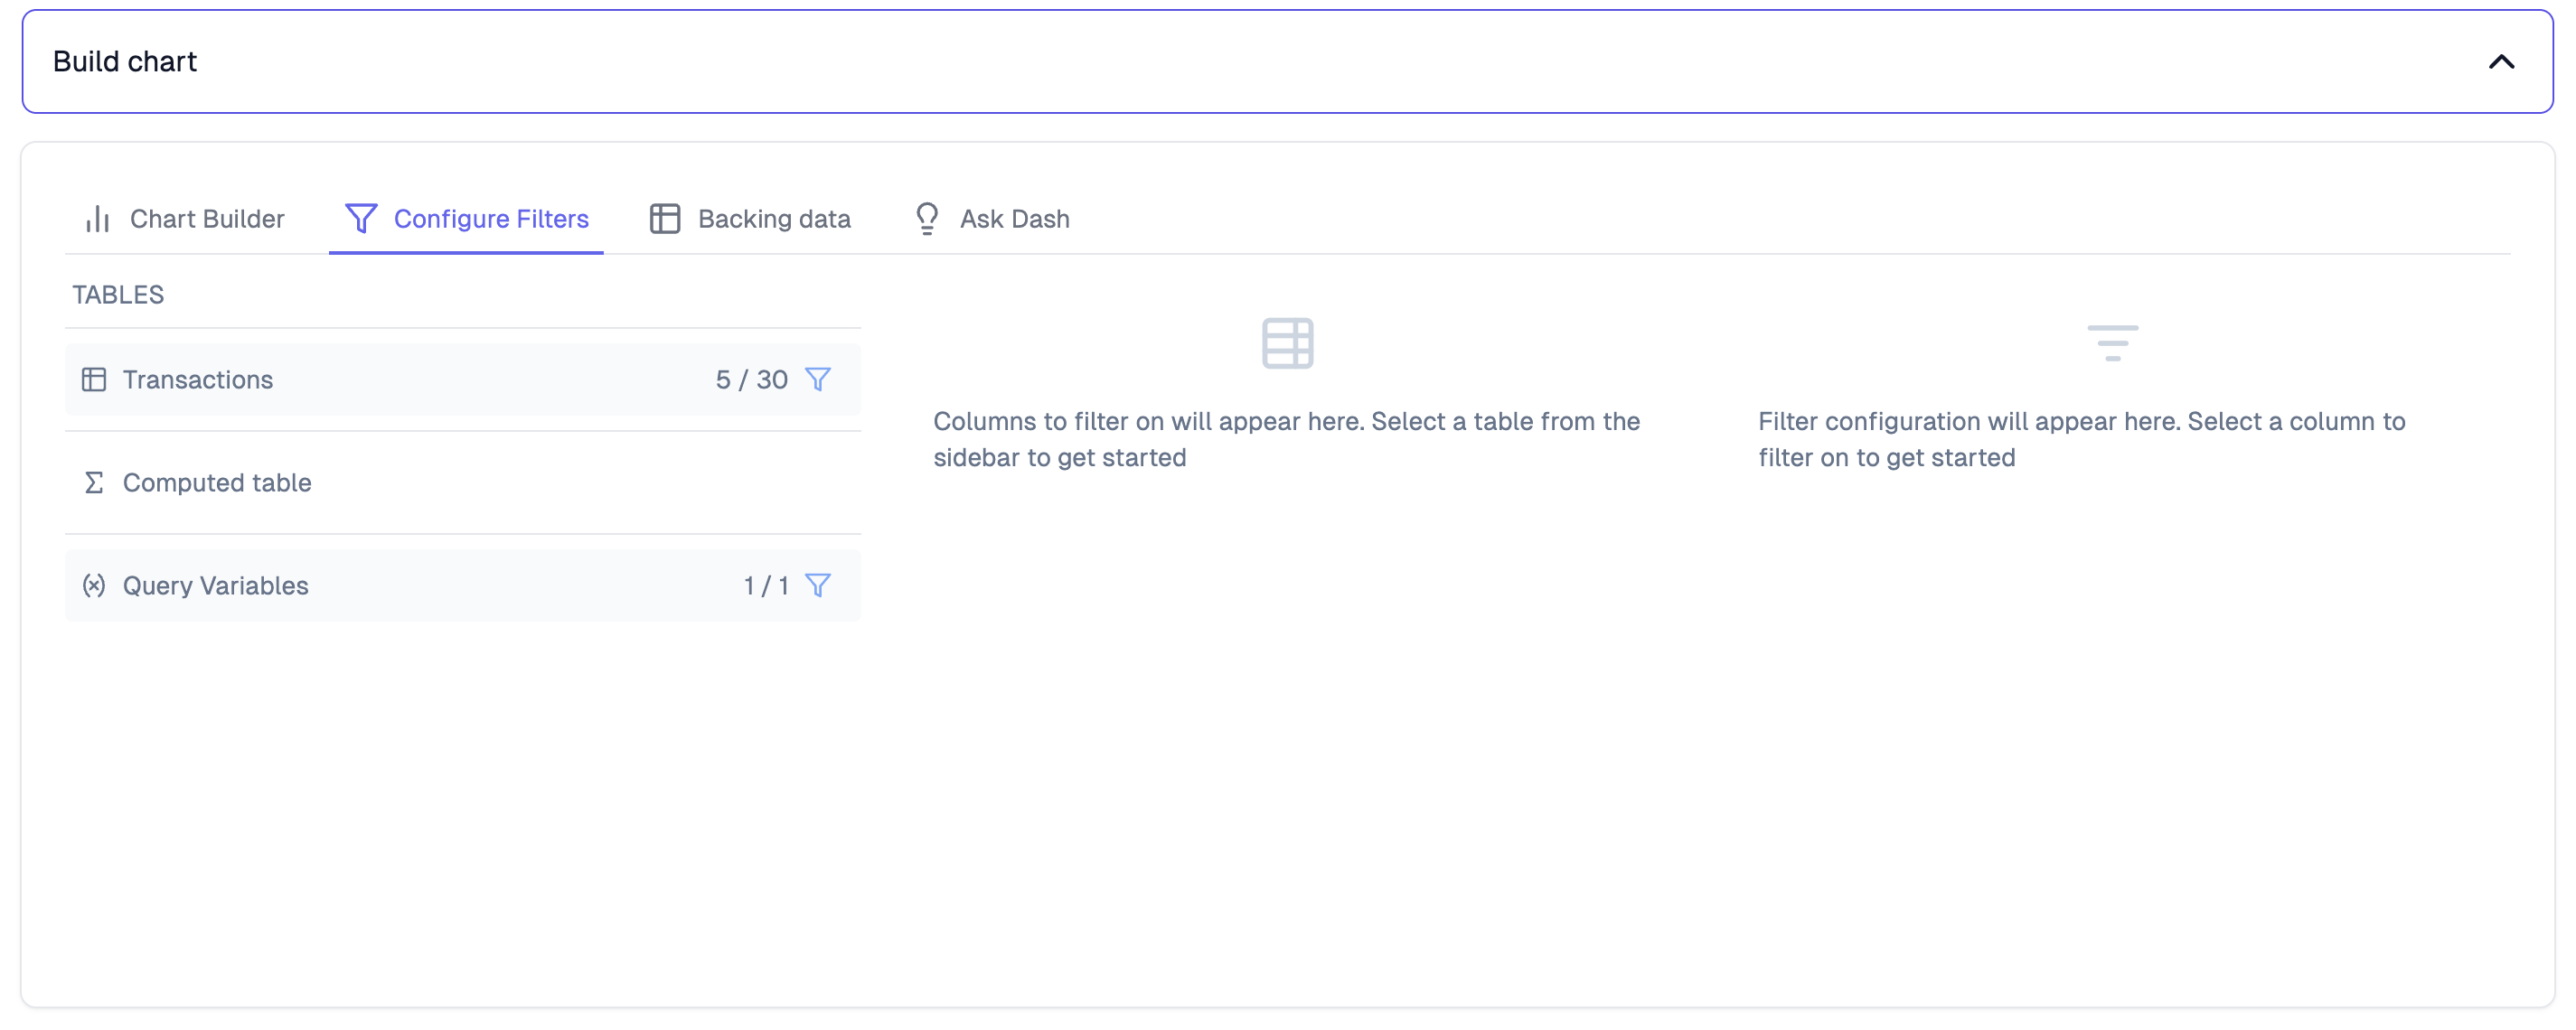 There are 3 things you can filter on:
**1. Raw backing tables:** filter any column in the raw data that is powering this specific chart
**2. Computed table:** filter any column from the data table that was computed by the SQL written for this chart
**3. Variables in the chart SQL:** inject variables into the SQL code that is backing this chart
There are 3 things you can filter on:
**1. Raw backing tables:** filter any column in the raw data that is powering this specific chart
**2. Computed table:** filter any column from the data table that was computed by the SQL written for this chart
**3. Variables in the chart SQL:** inject variables into the SQL code that is backing this chart
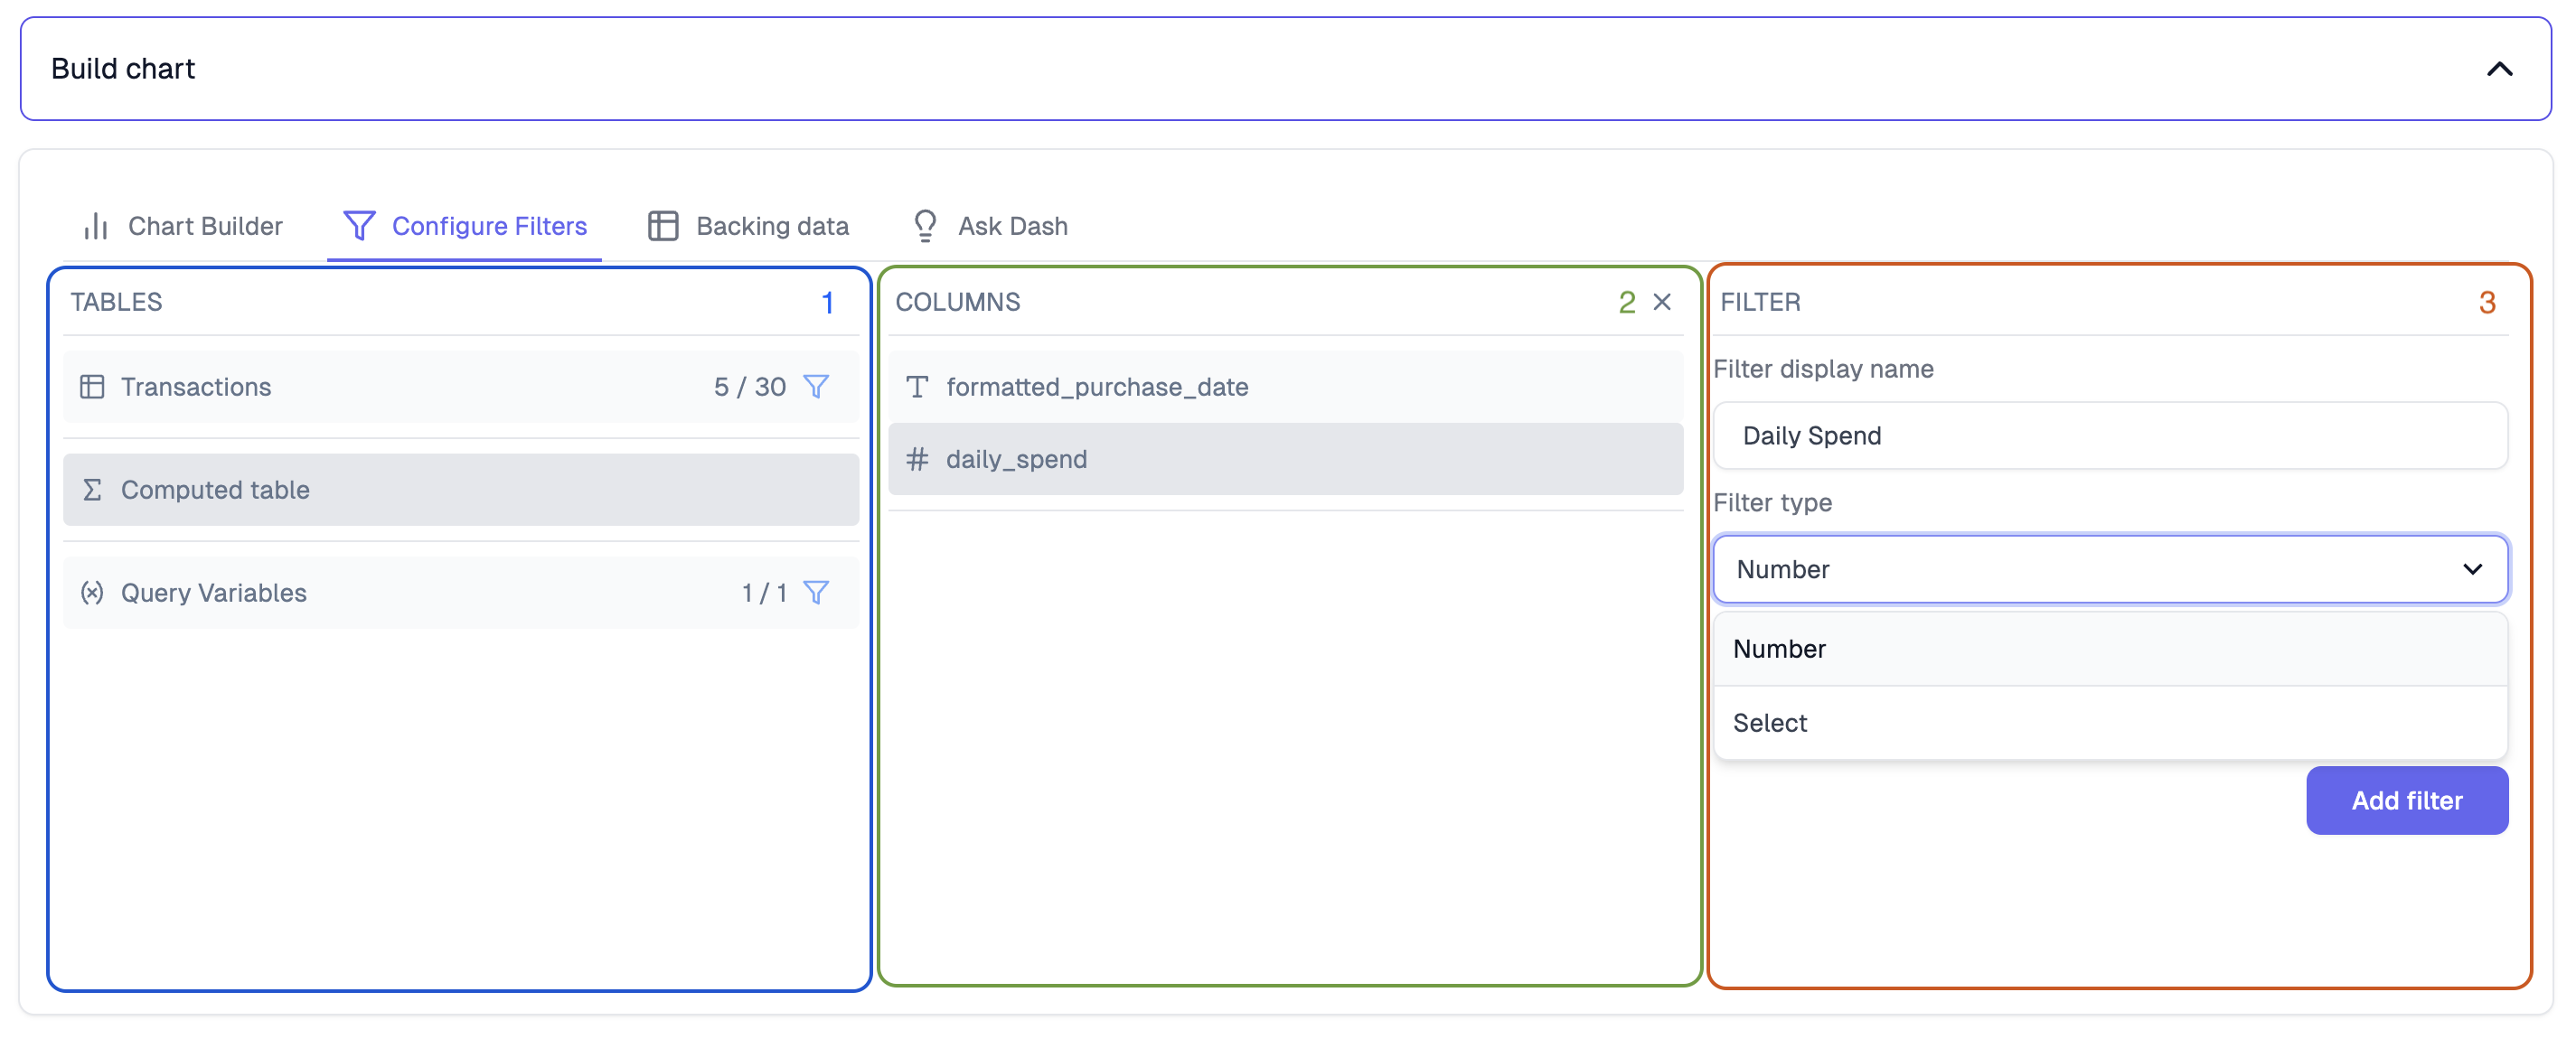
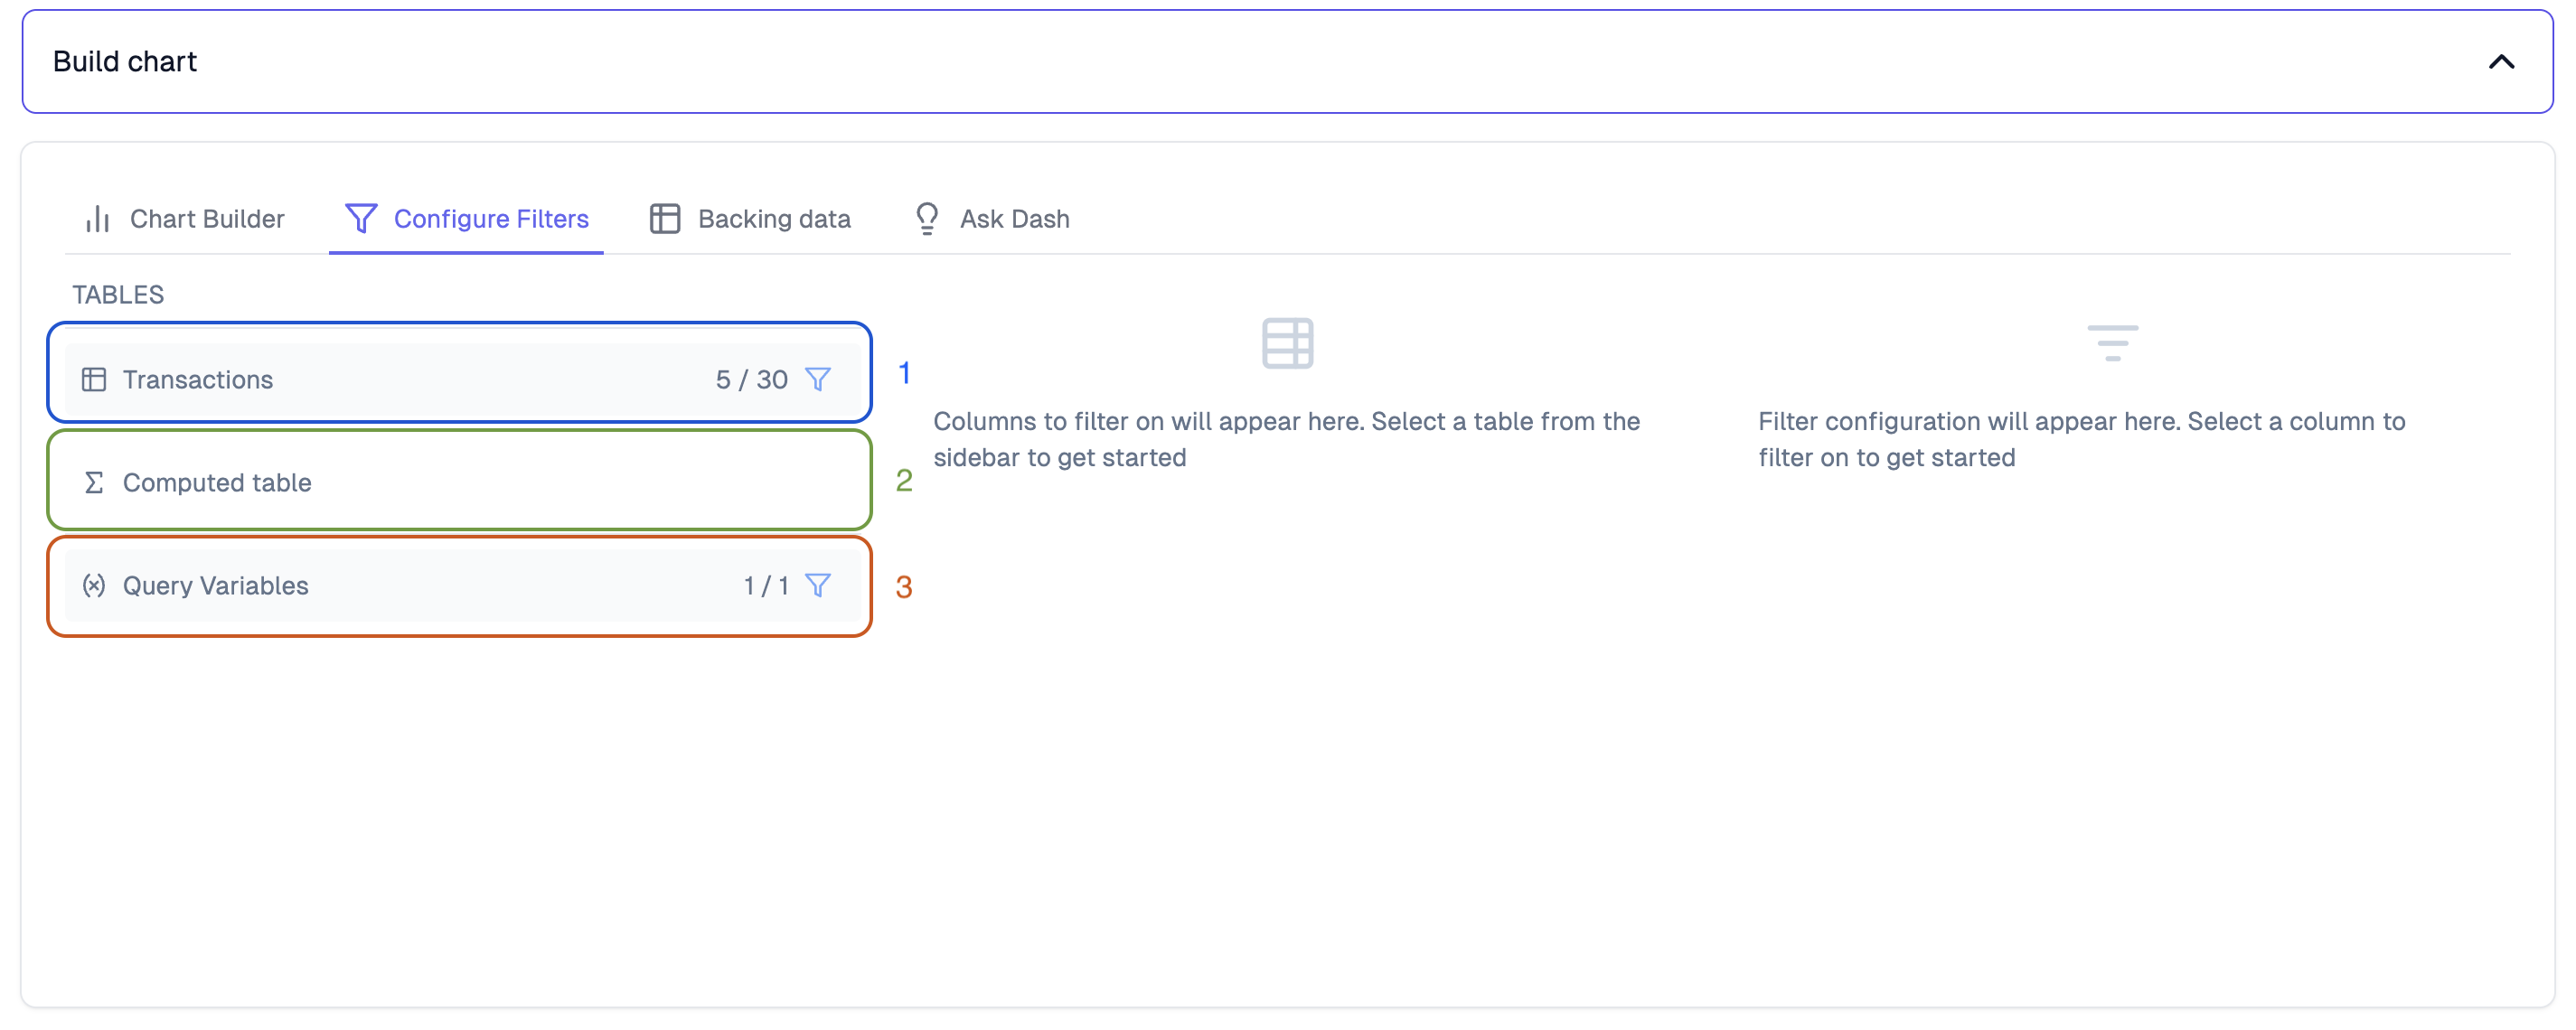 There are 3 steps to configuring a filter:
**1. Table:** select the table to filter or "Query variables"
**2. Column:** select the column or variable to filter on
**3. Filter:** configure the filter as needed. Options will be provided based on the type of filter selected
There are 3 steps to configuring a filter:
**1. Table:** select the table to filter or "Query variables"
**2. Column:** select the column or variable to filter on
**3. Filter:** configure the filter as needed. Options will be provided based on the type of filter selected
 Once the filter is added, navigate back to the `Chart Builder` tab to check it out. Click the blue filter icon to see all available filters. Setting one will add the filter to your chart
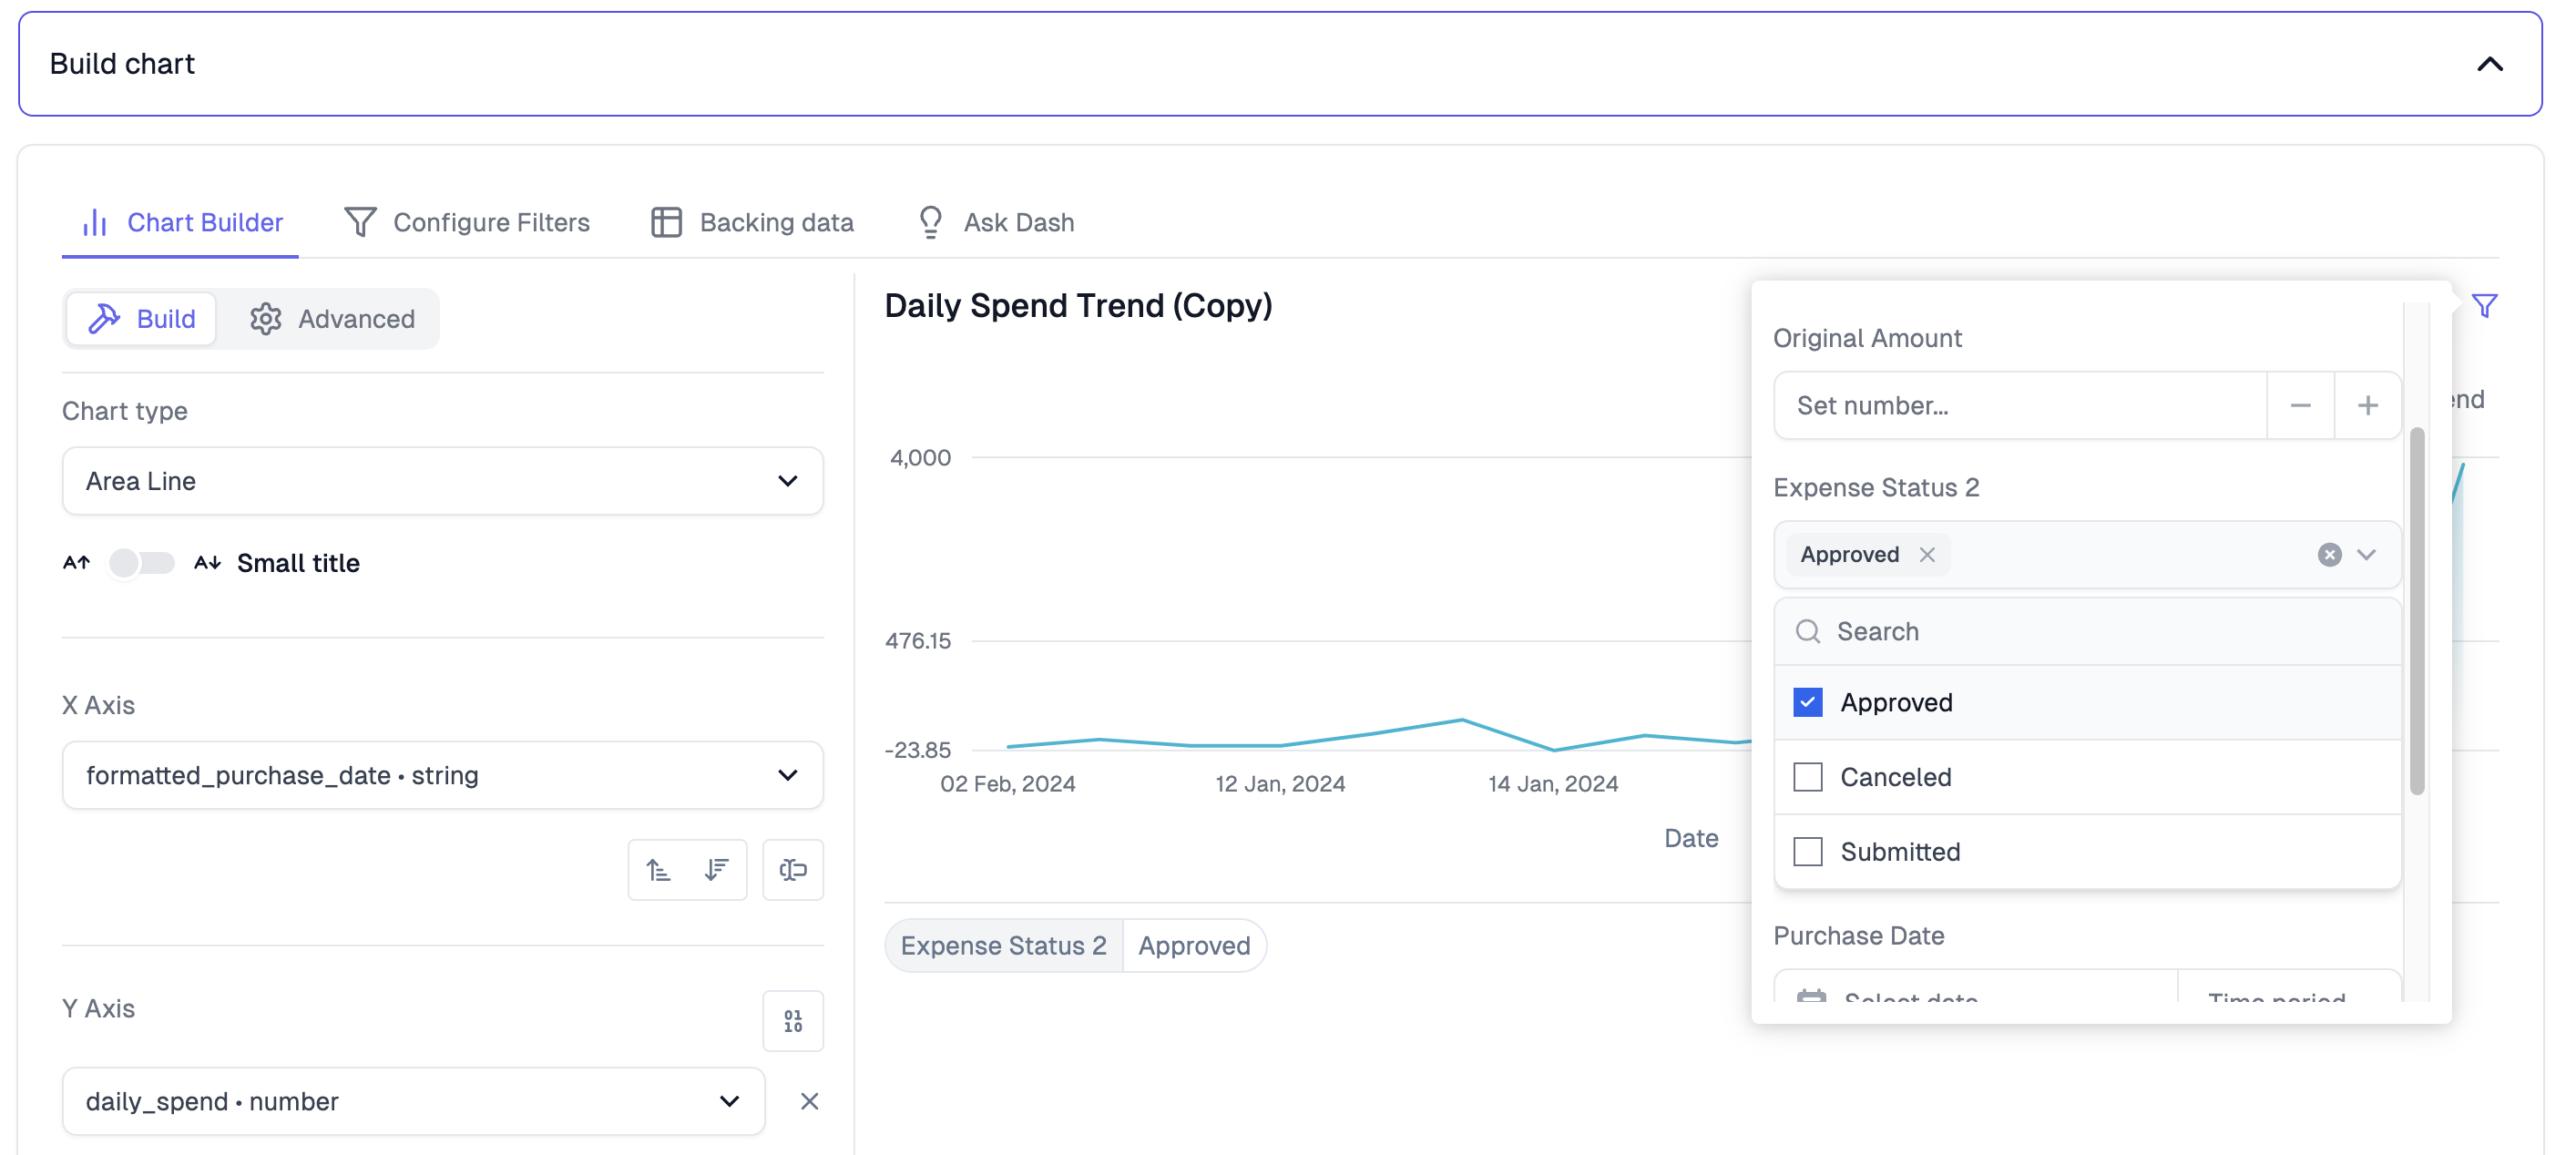 If you are happy with your result, `Save` the chart and let's configure this in the dashboard!
## Dashboard filters
To create a dashboard filter, go into the dashboard editor and click the `+ New filter` button.
If you are happy with your result, `Save` the chart and let's configure this in the dashboard!
## Dashboard filters
To create a dashboard filter, go into the dashboard editor and click the `+ New filter` button.
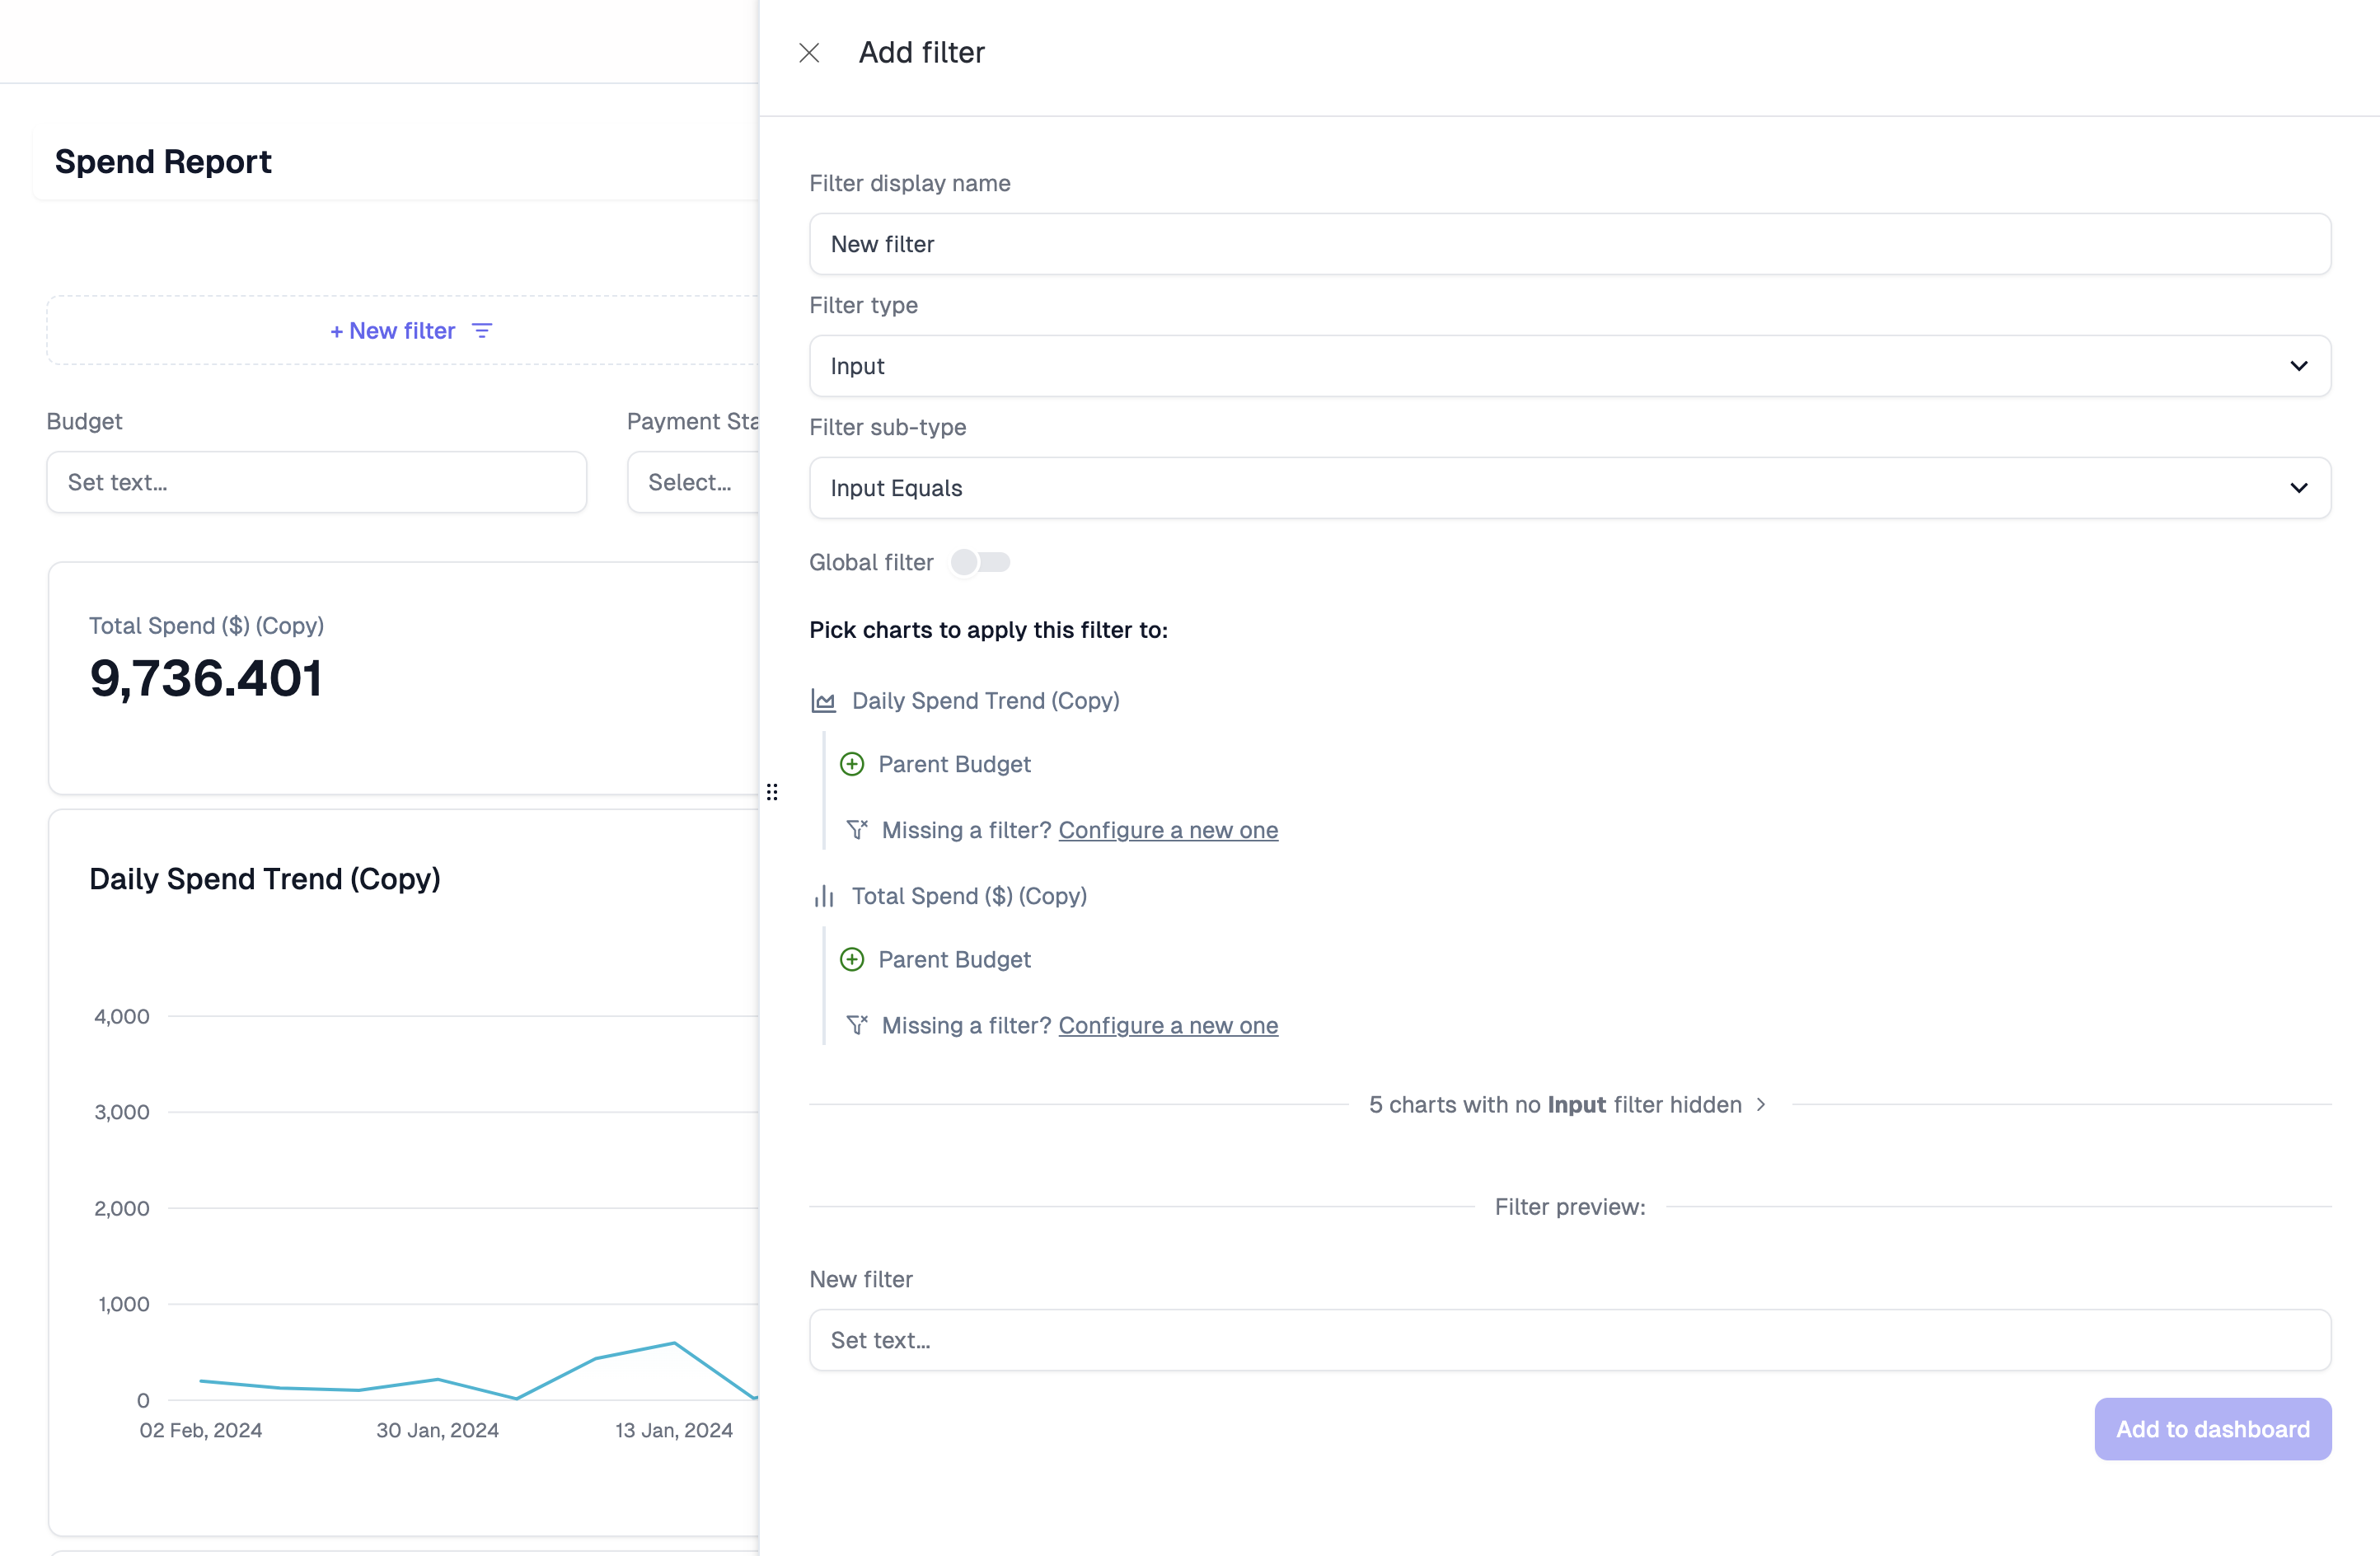 Give your filter a name, and set the type and subtype. In this case, we are going to set a `Select` filter with multiple options allowed.
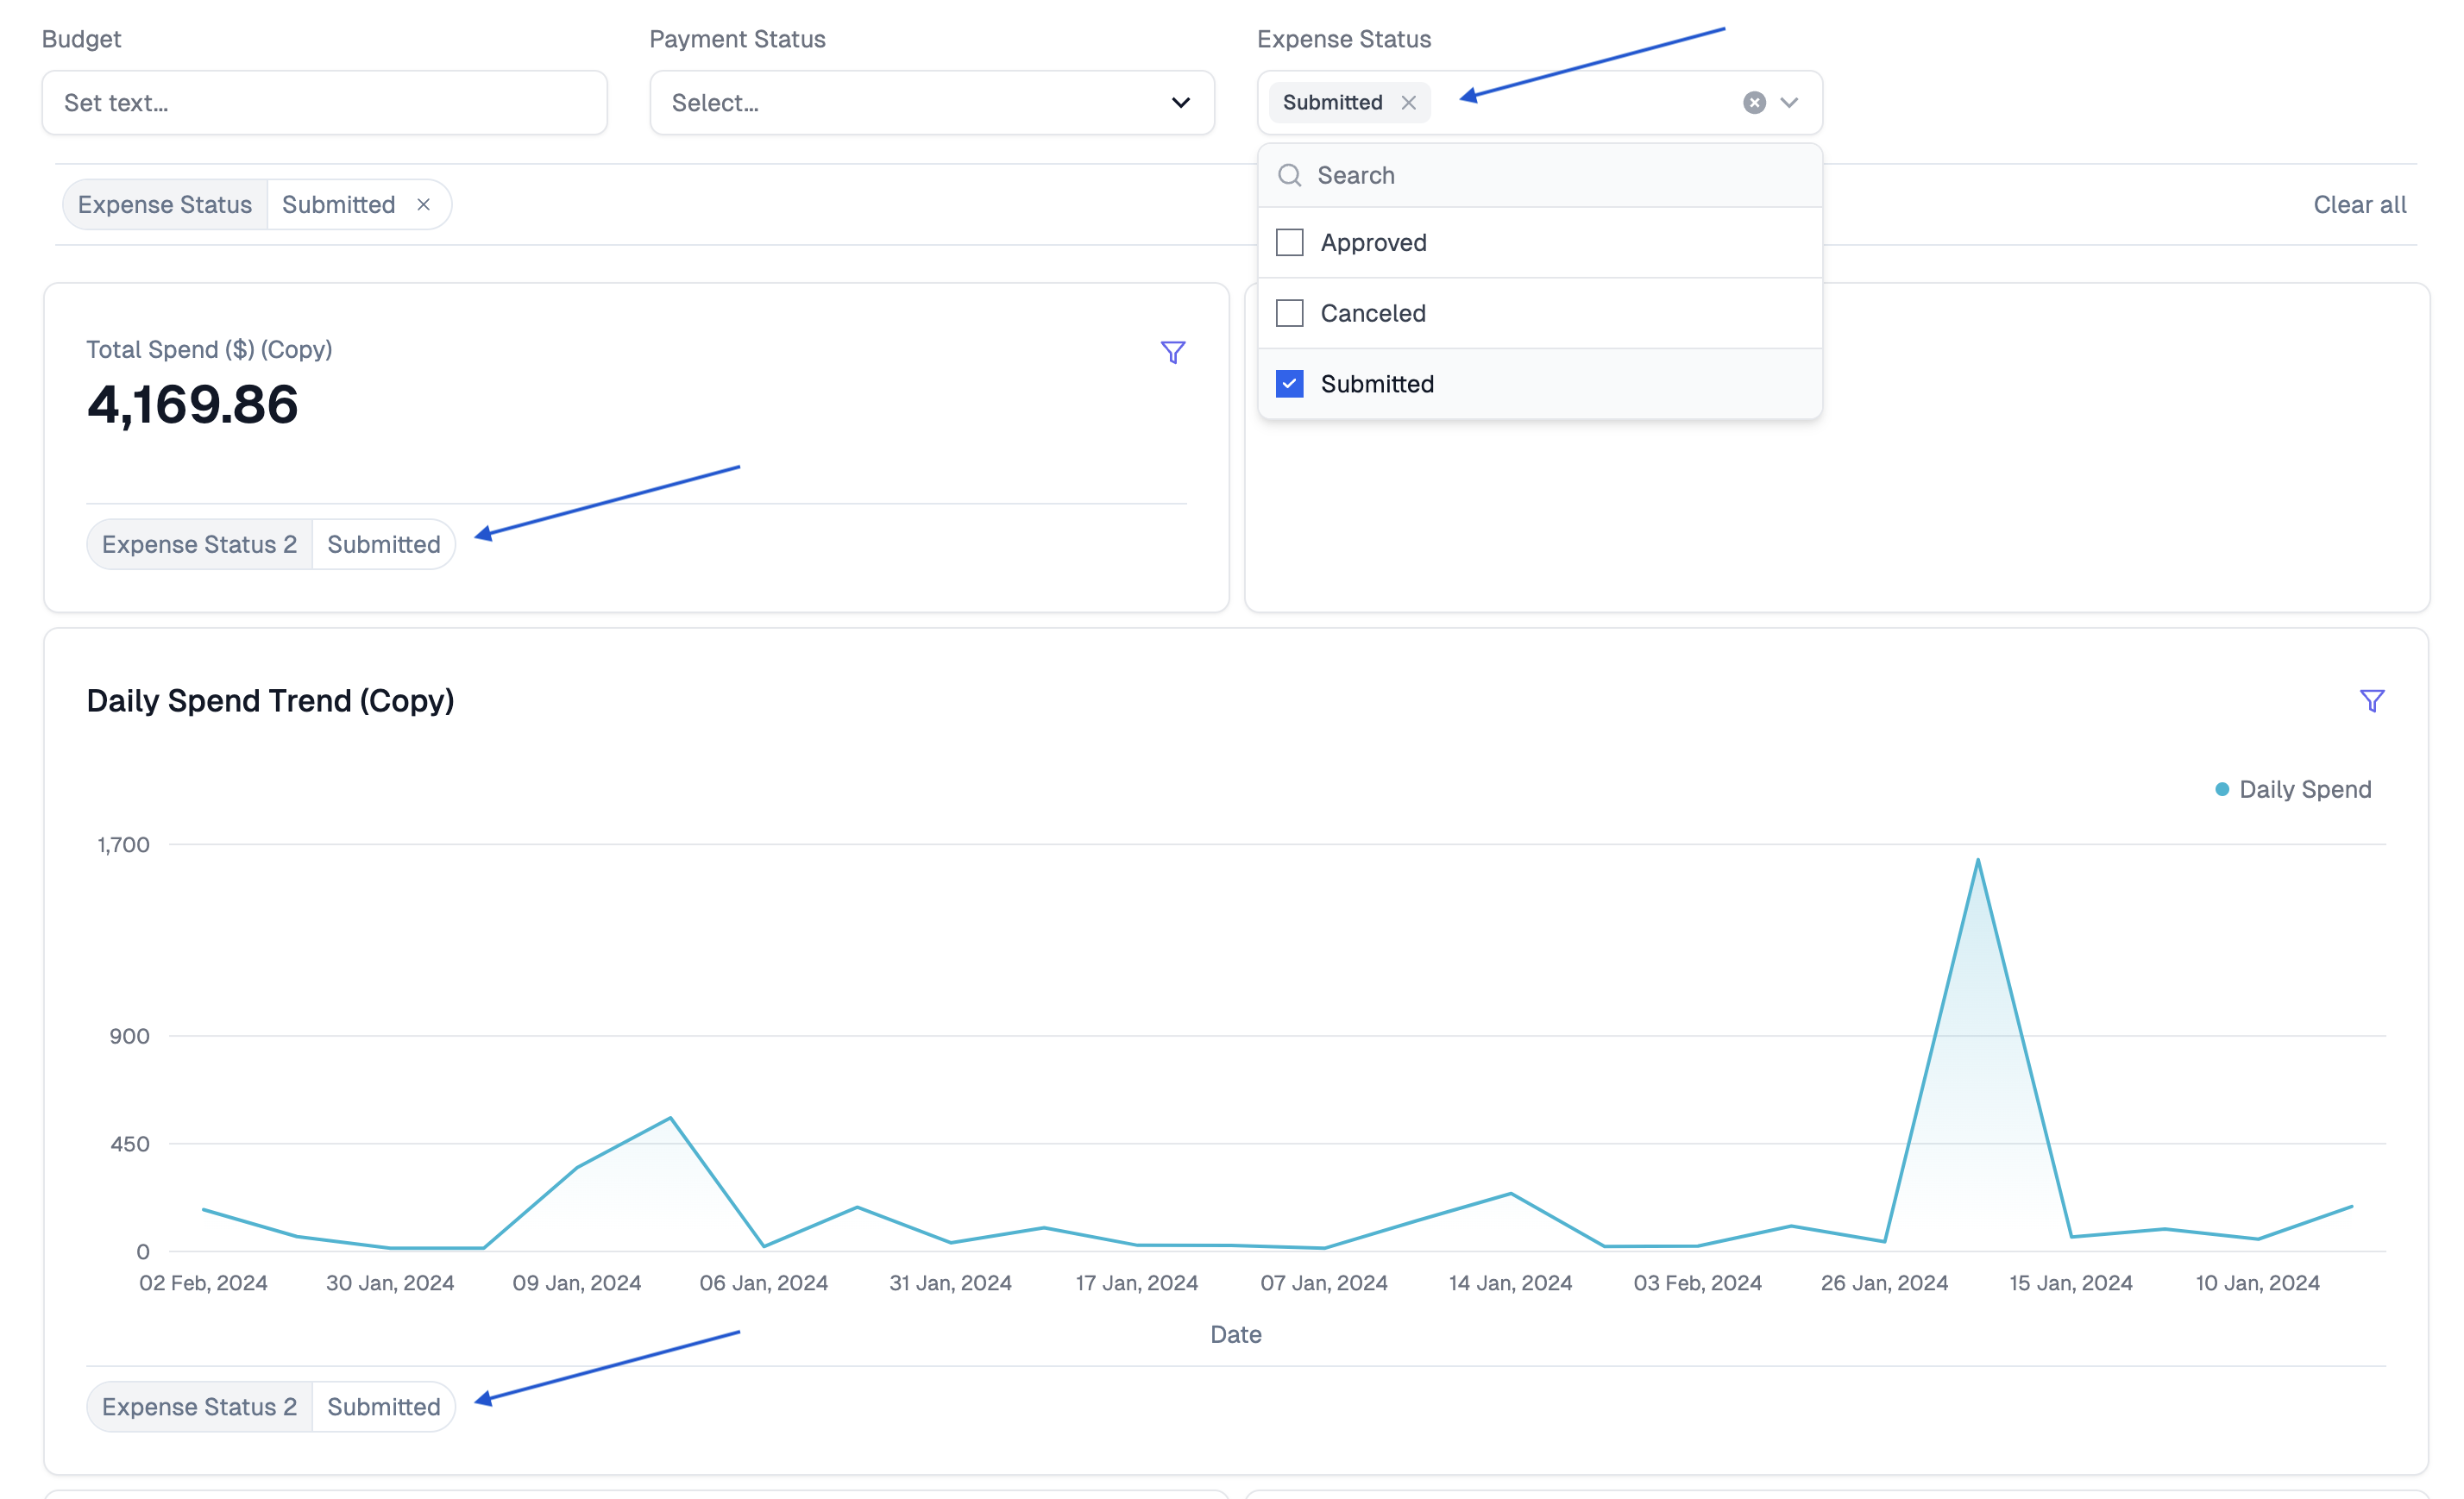
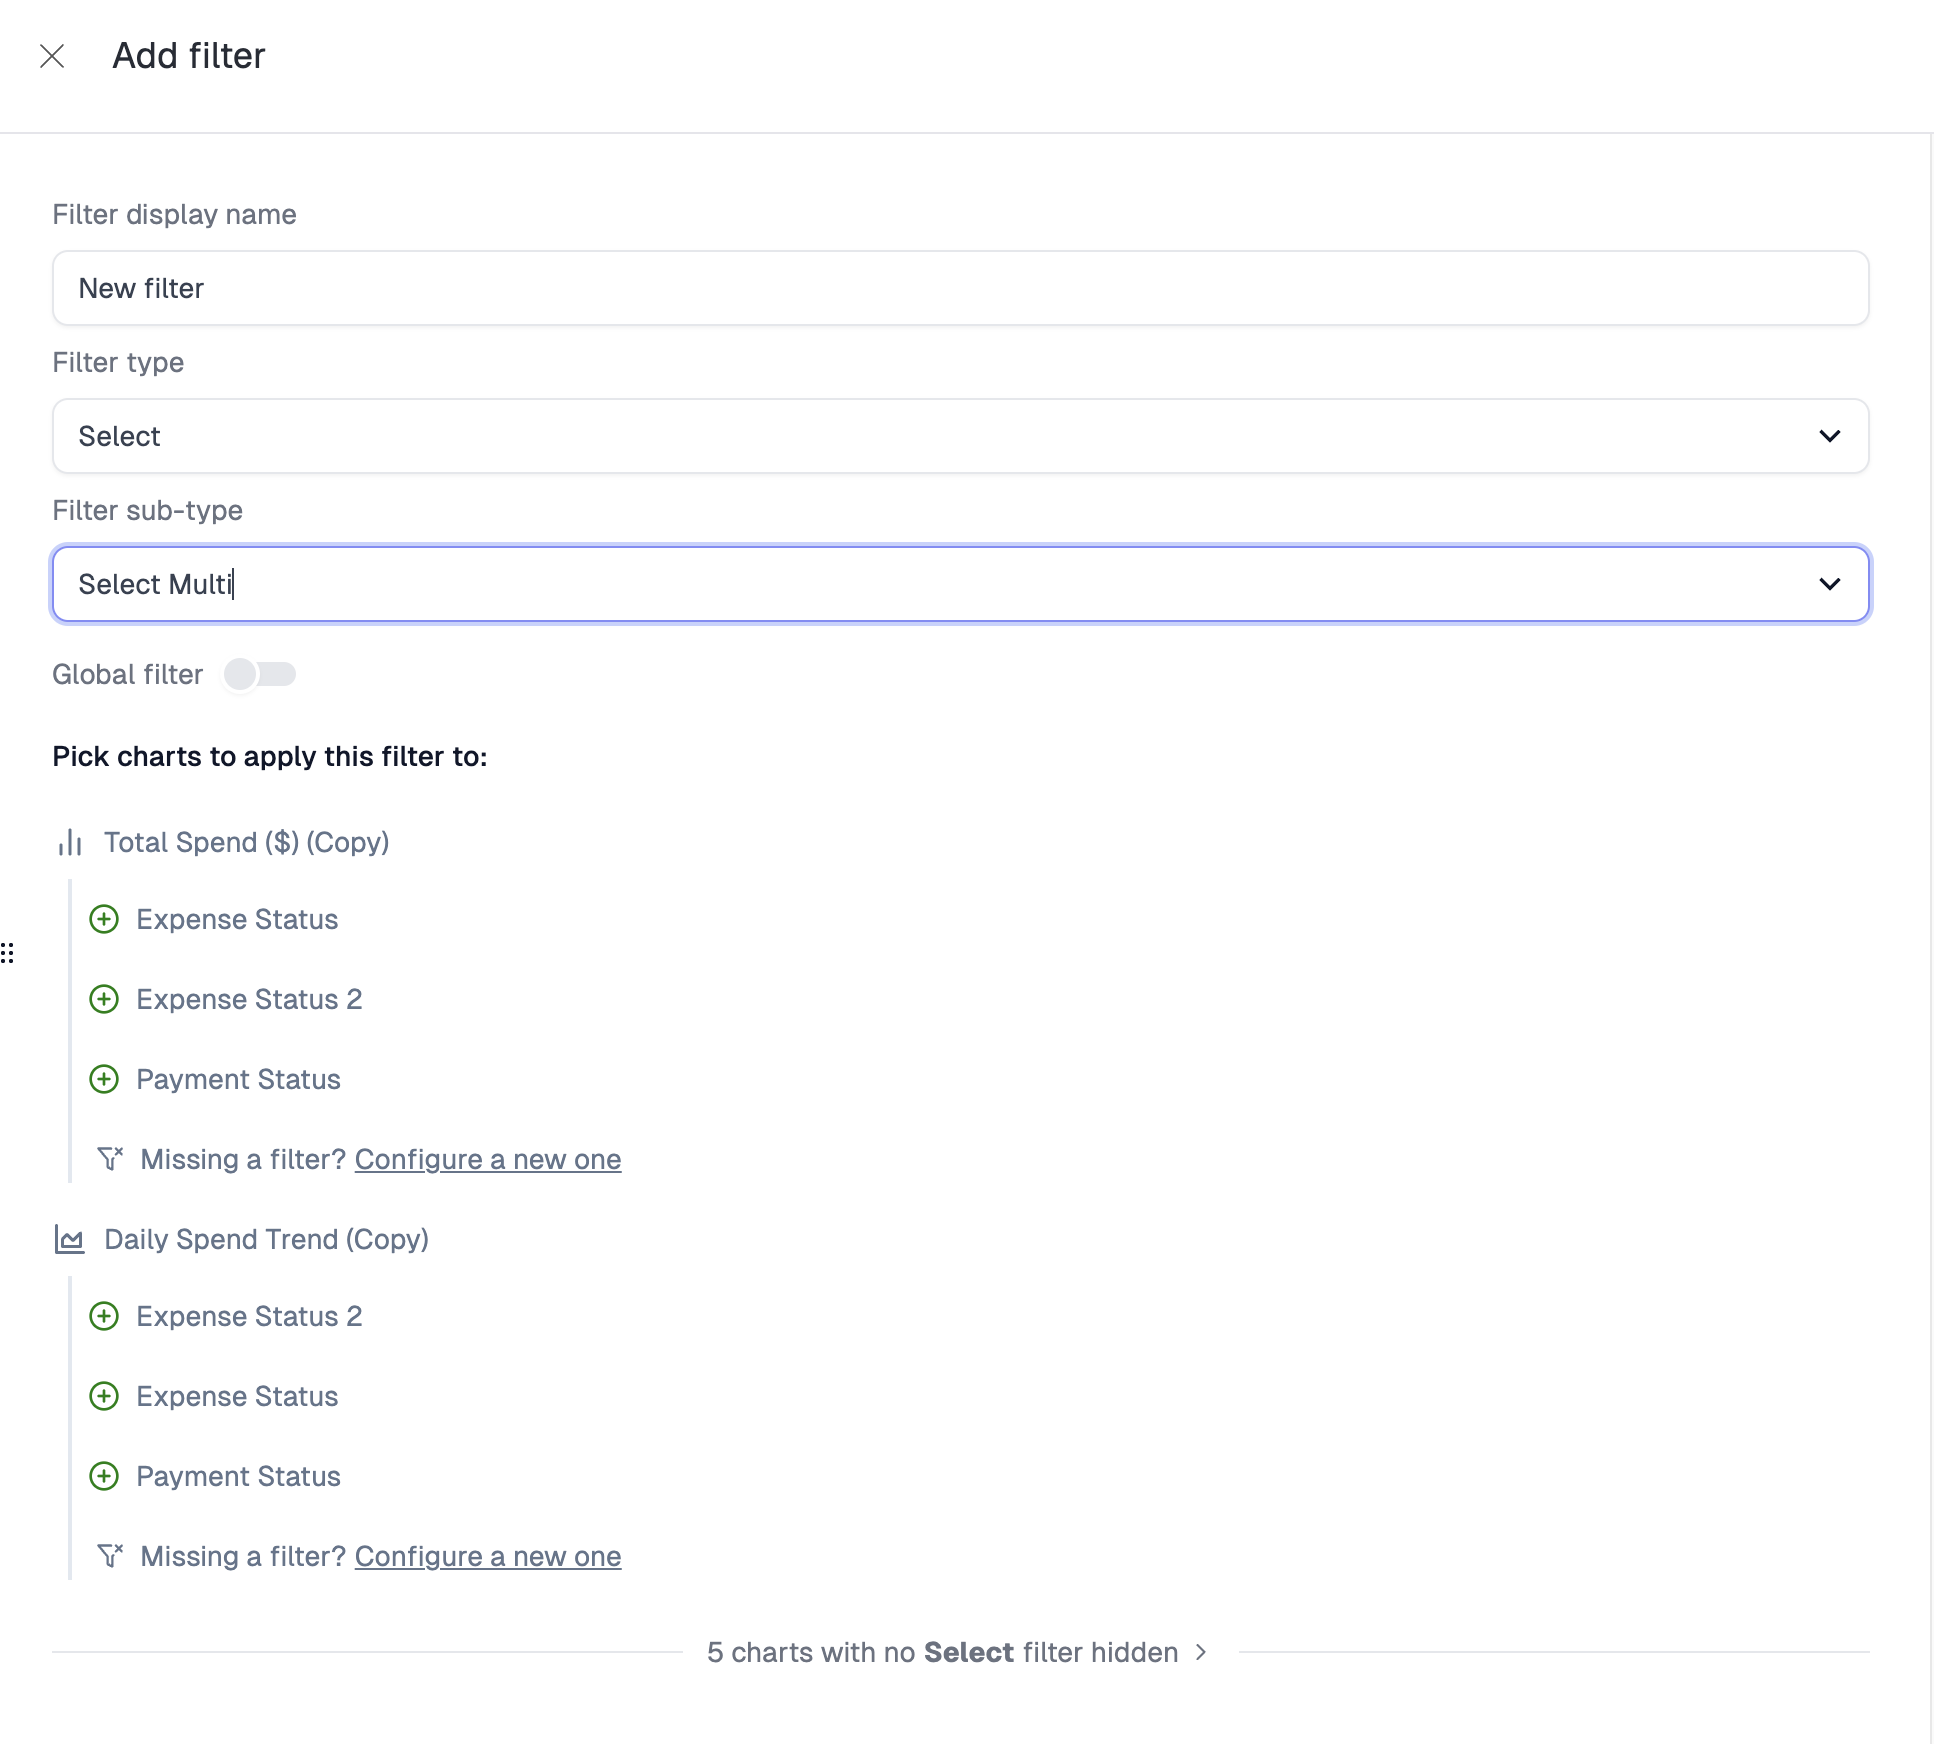 Note that there are only 2 charts on this dashboard that have `Select` filters avaialble for us to map to. Select the ones that this dashboard filter should map to. In this case, it will be `Expense Status 2` in both `Total Spend ($) (Copy)` and `Daily Spend Trend (Copy)`. Click the **green (+) button** next to each filter you want to target and you will see this:
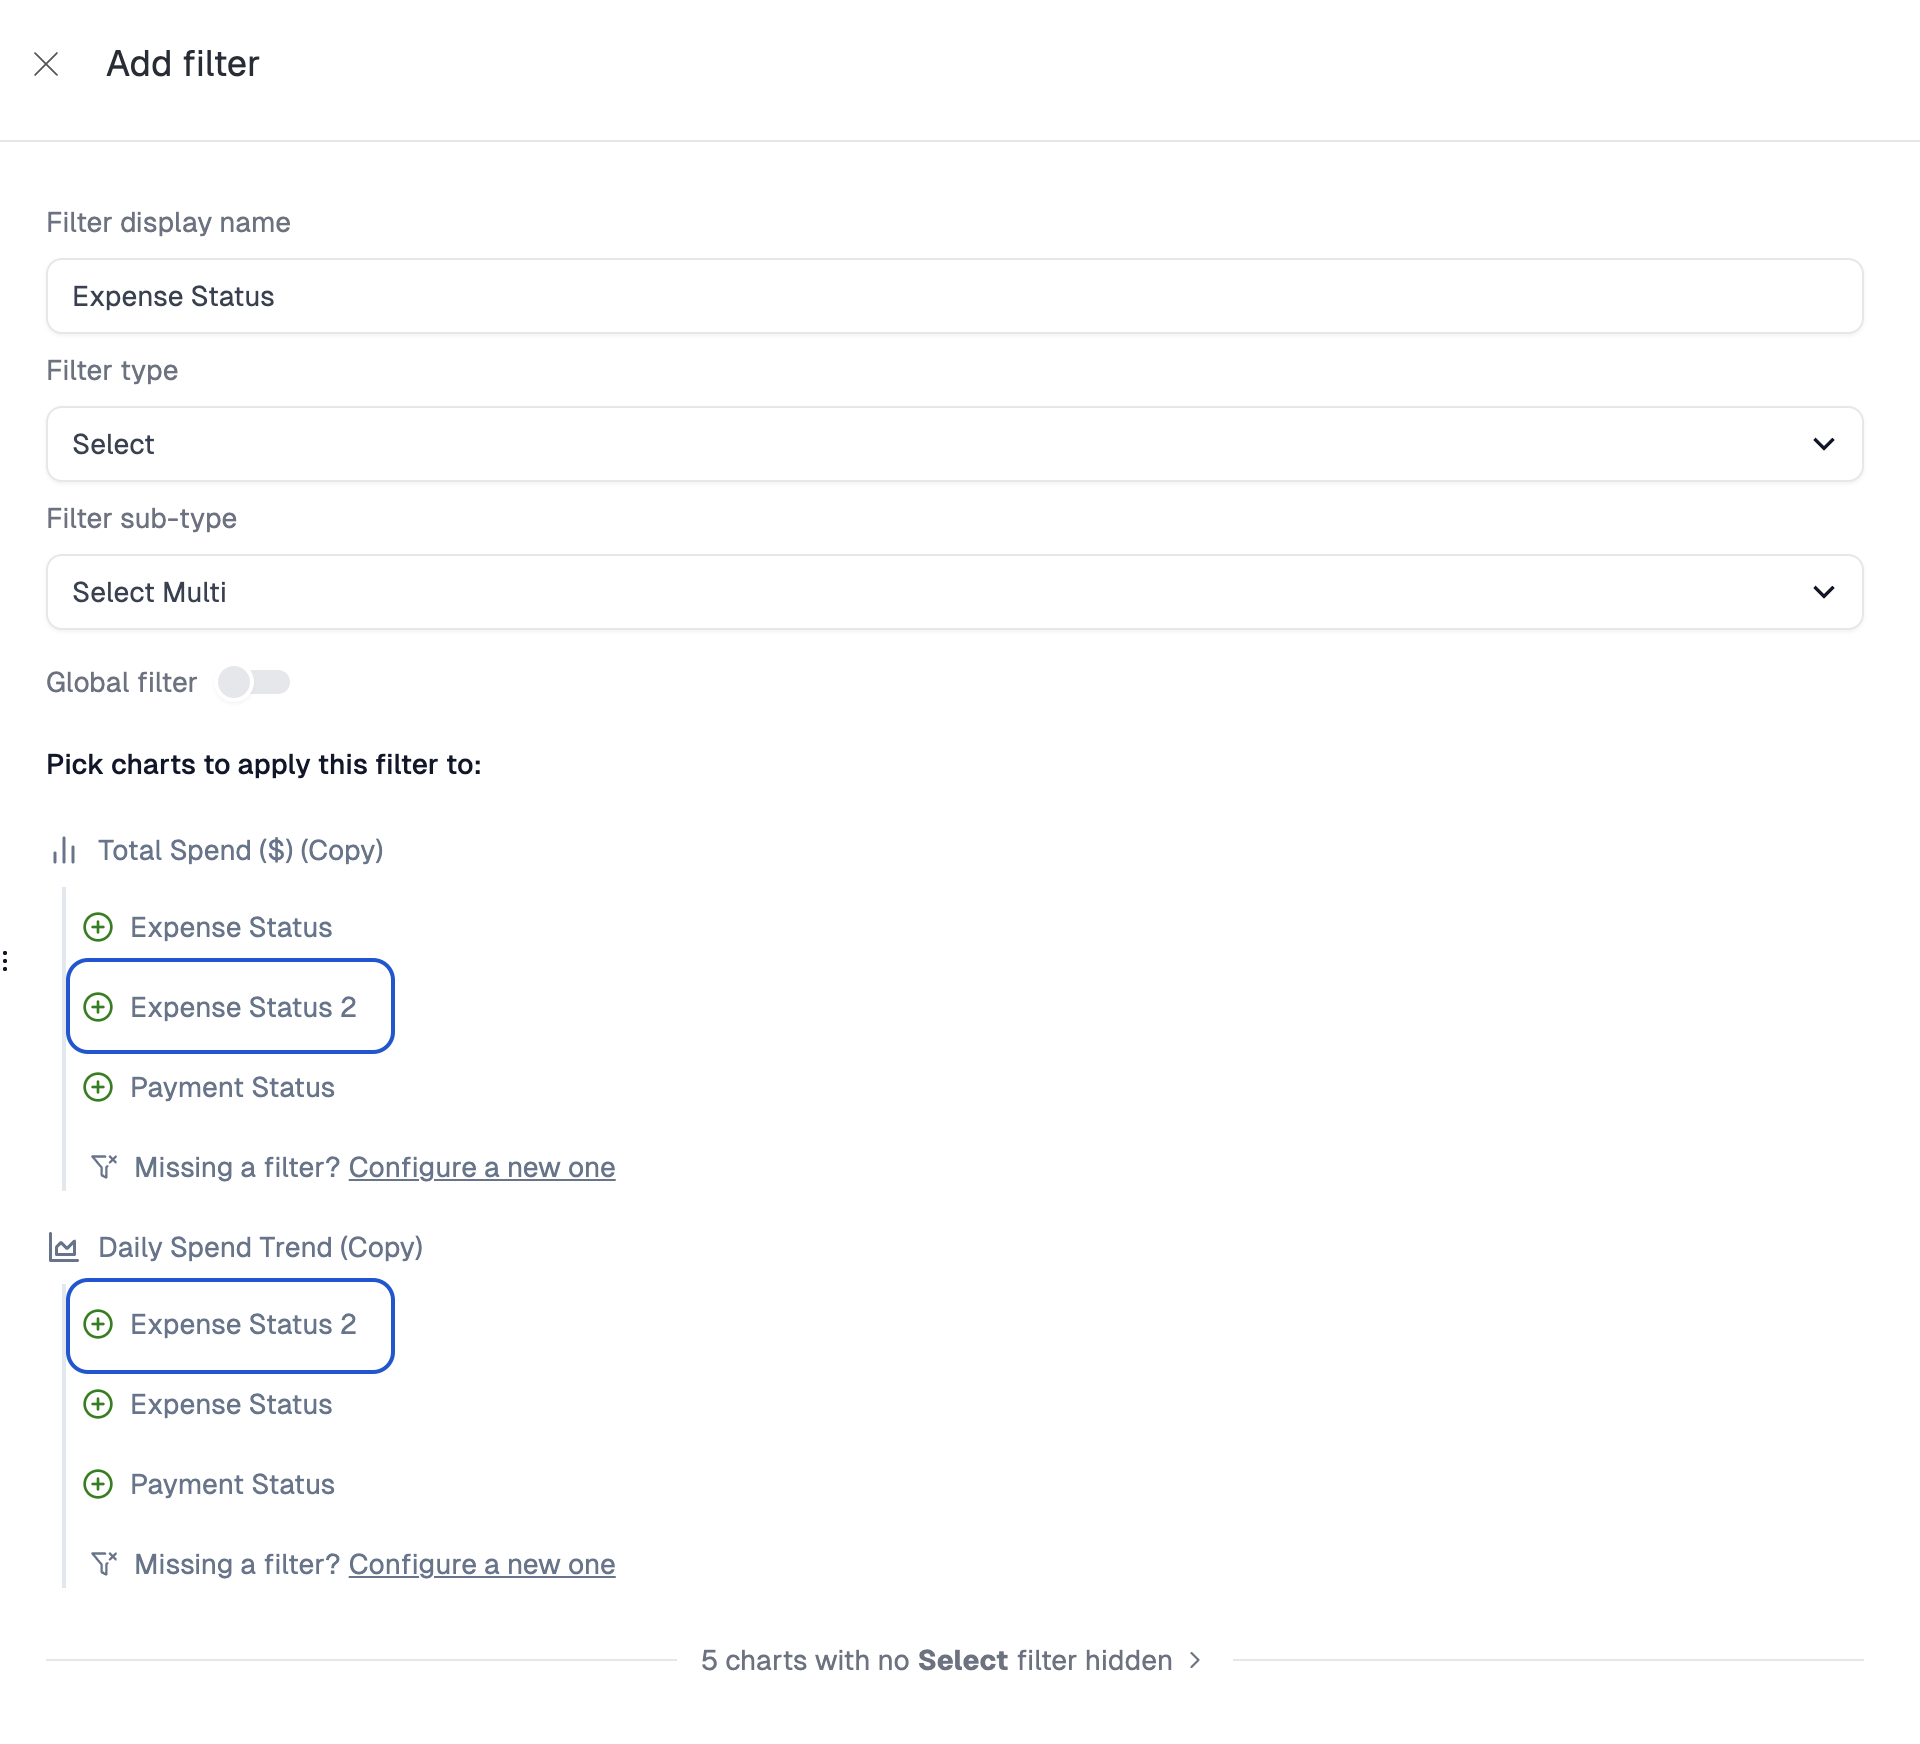
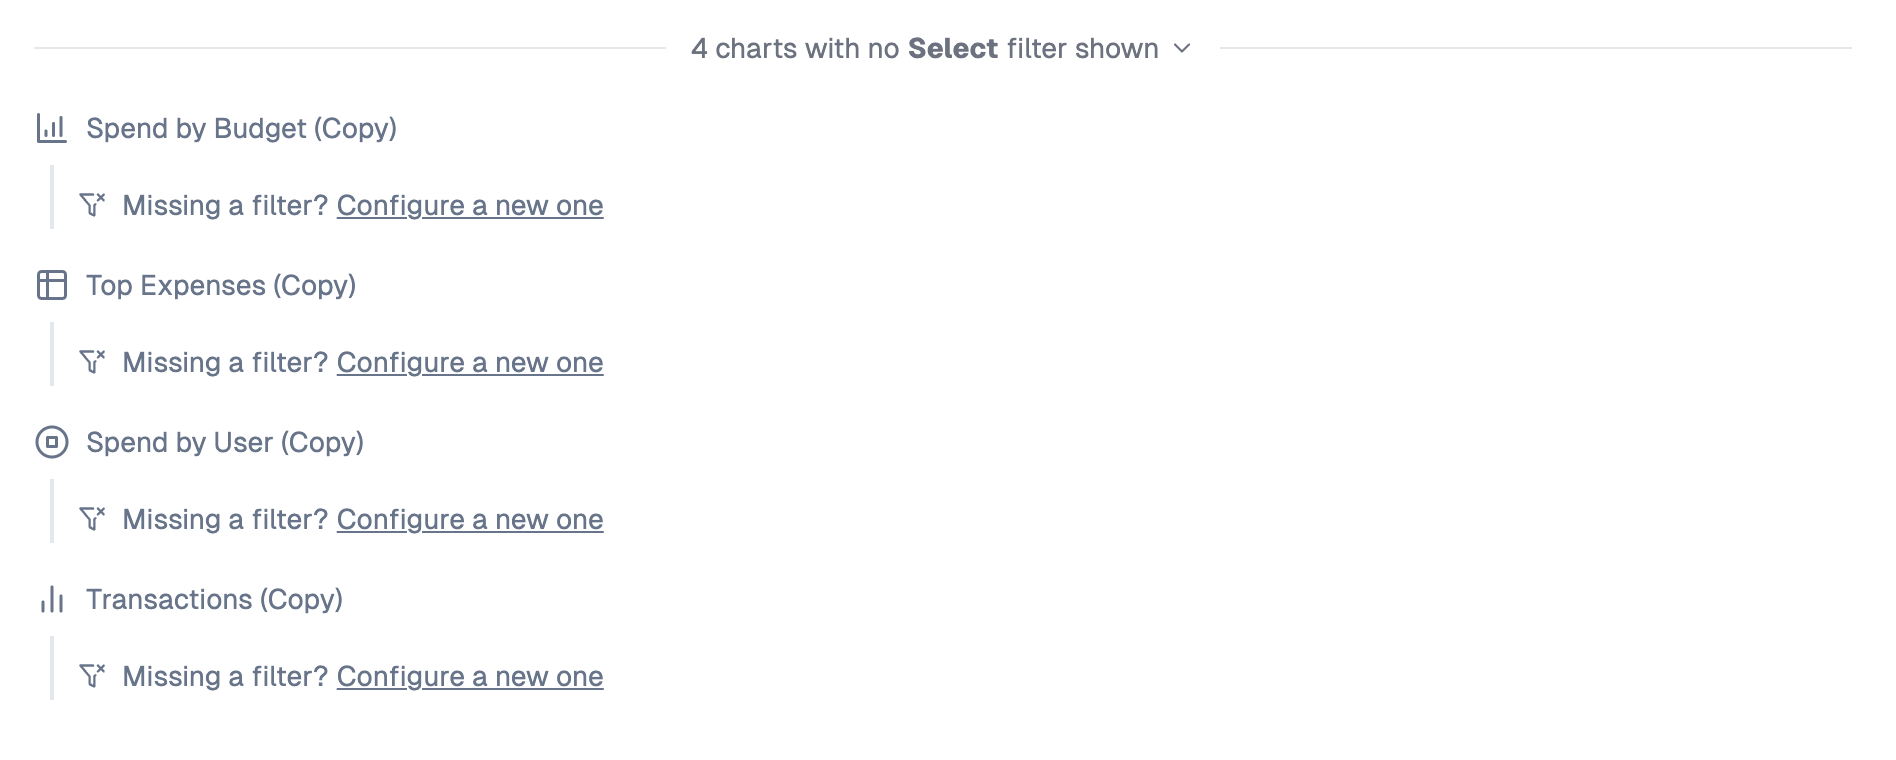
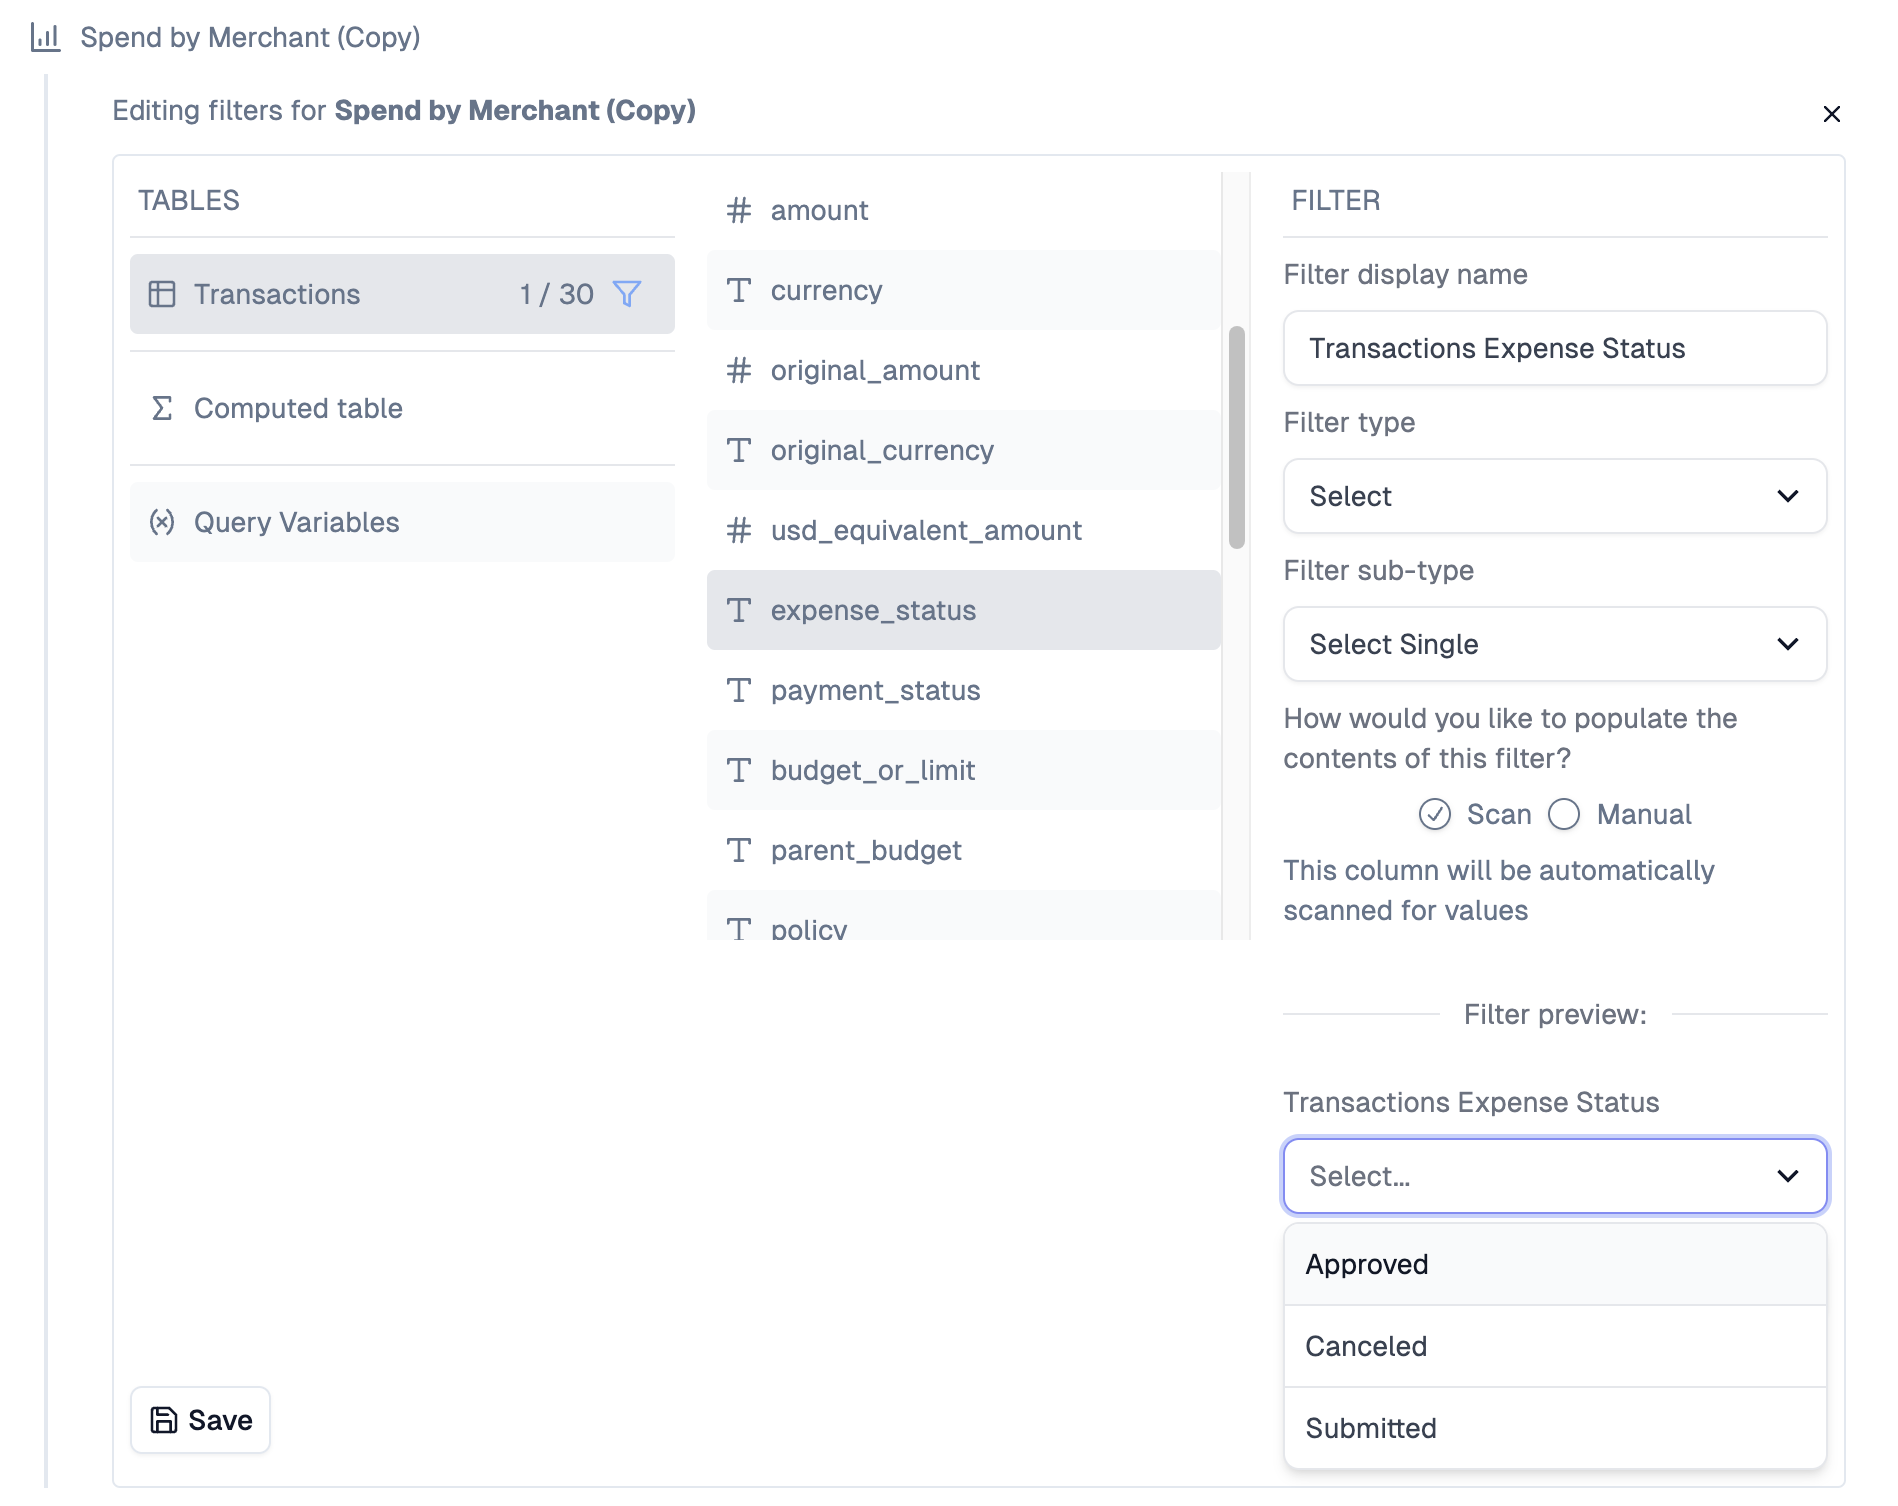
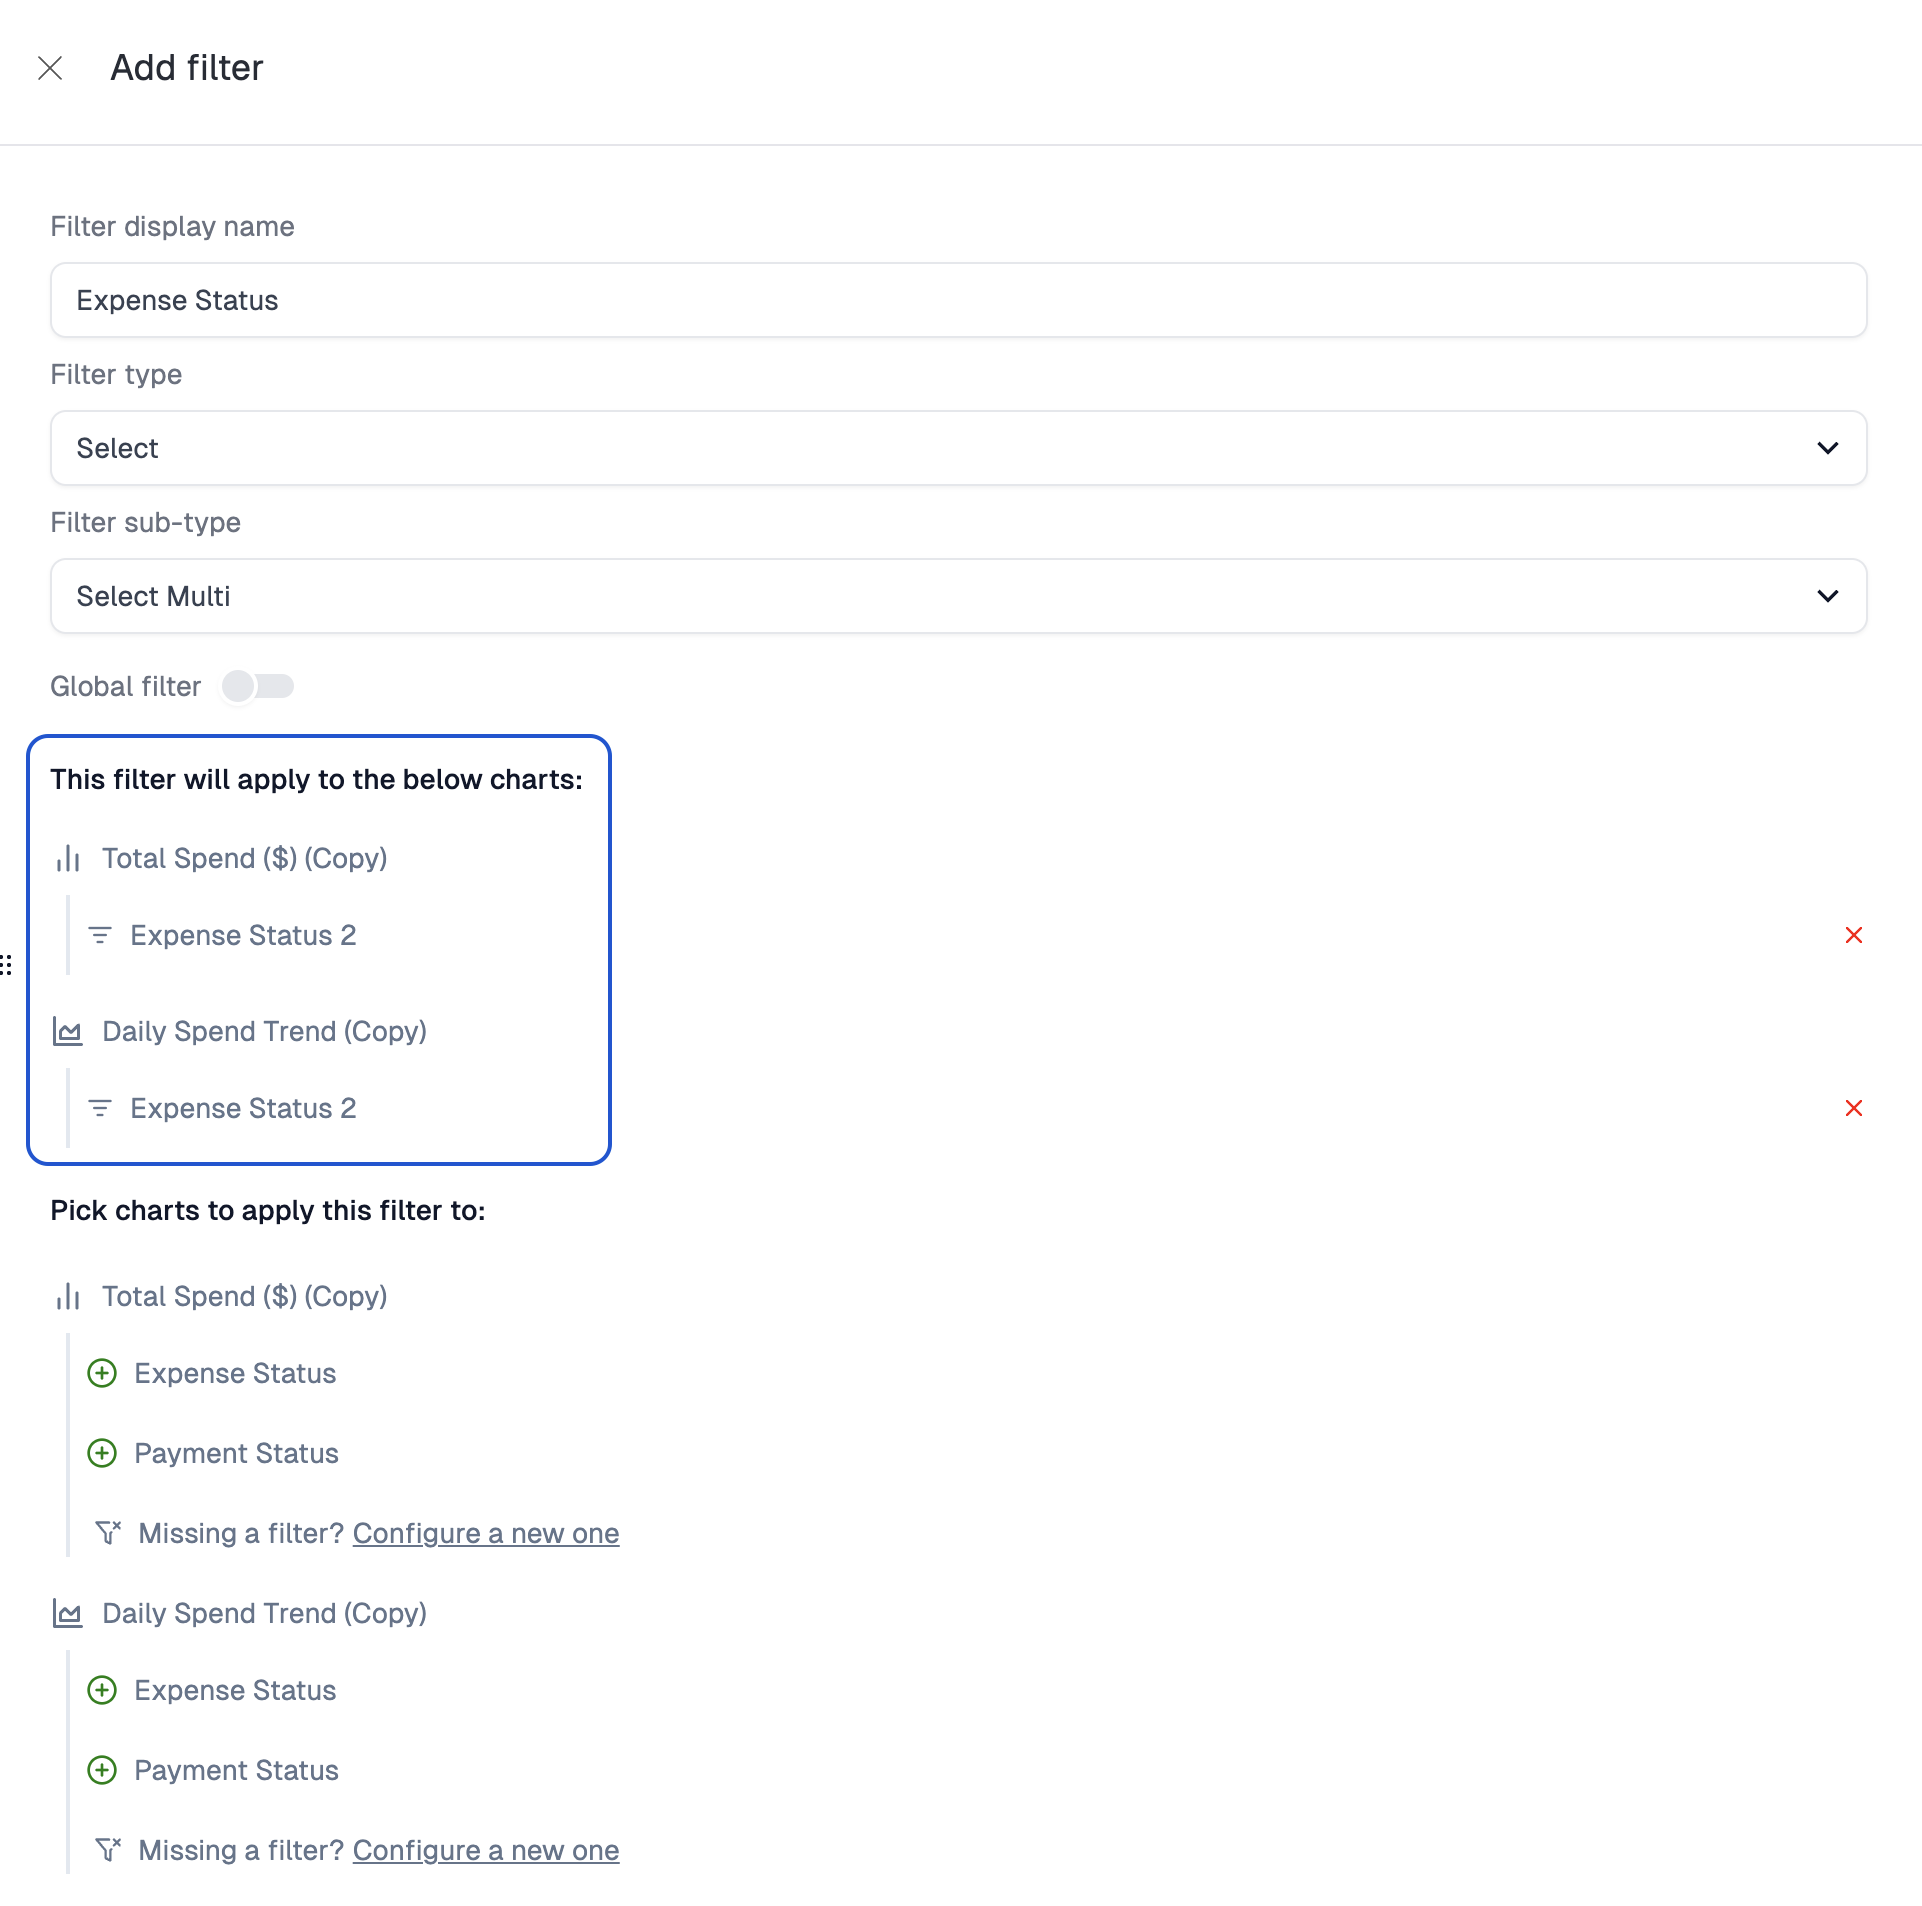 Now, there are more expense statuses I want to map to, but the charts that are in this dashboard don't yet have those filters created on them. We can add them from this menu. Click the `# charts with no Select filter shown` button to reveal the other charts. Pick the one you want, such as `Spend by Merchant (Copy)`. Configure it to be a `Select` filter and preview to make sure things worked.
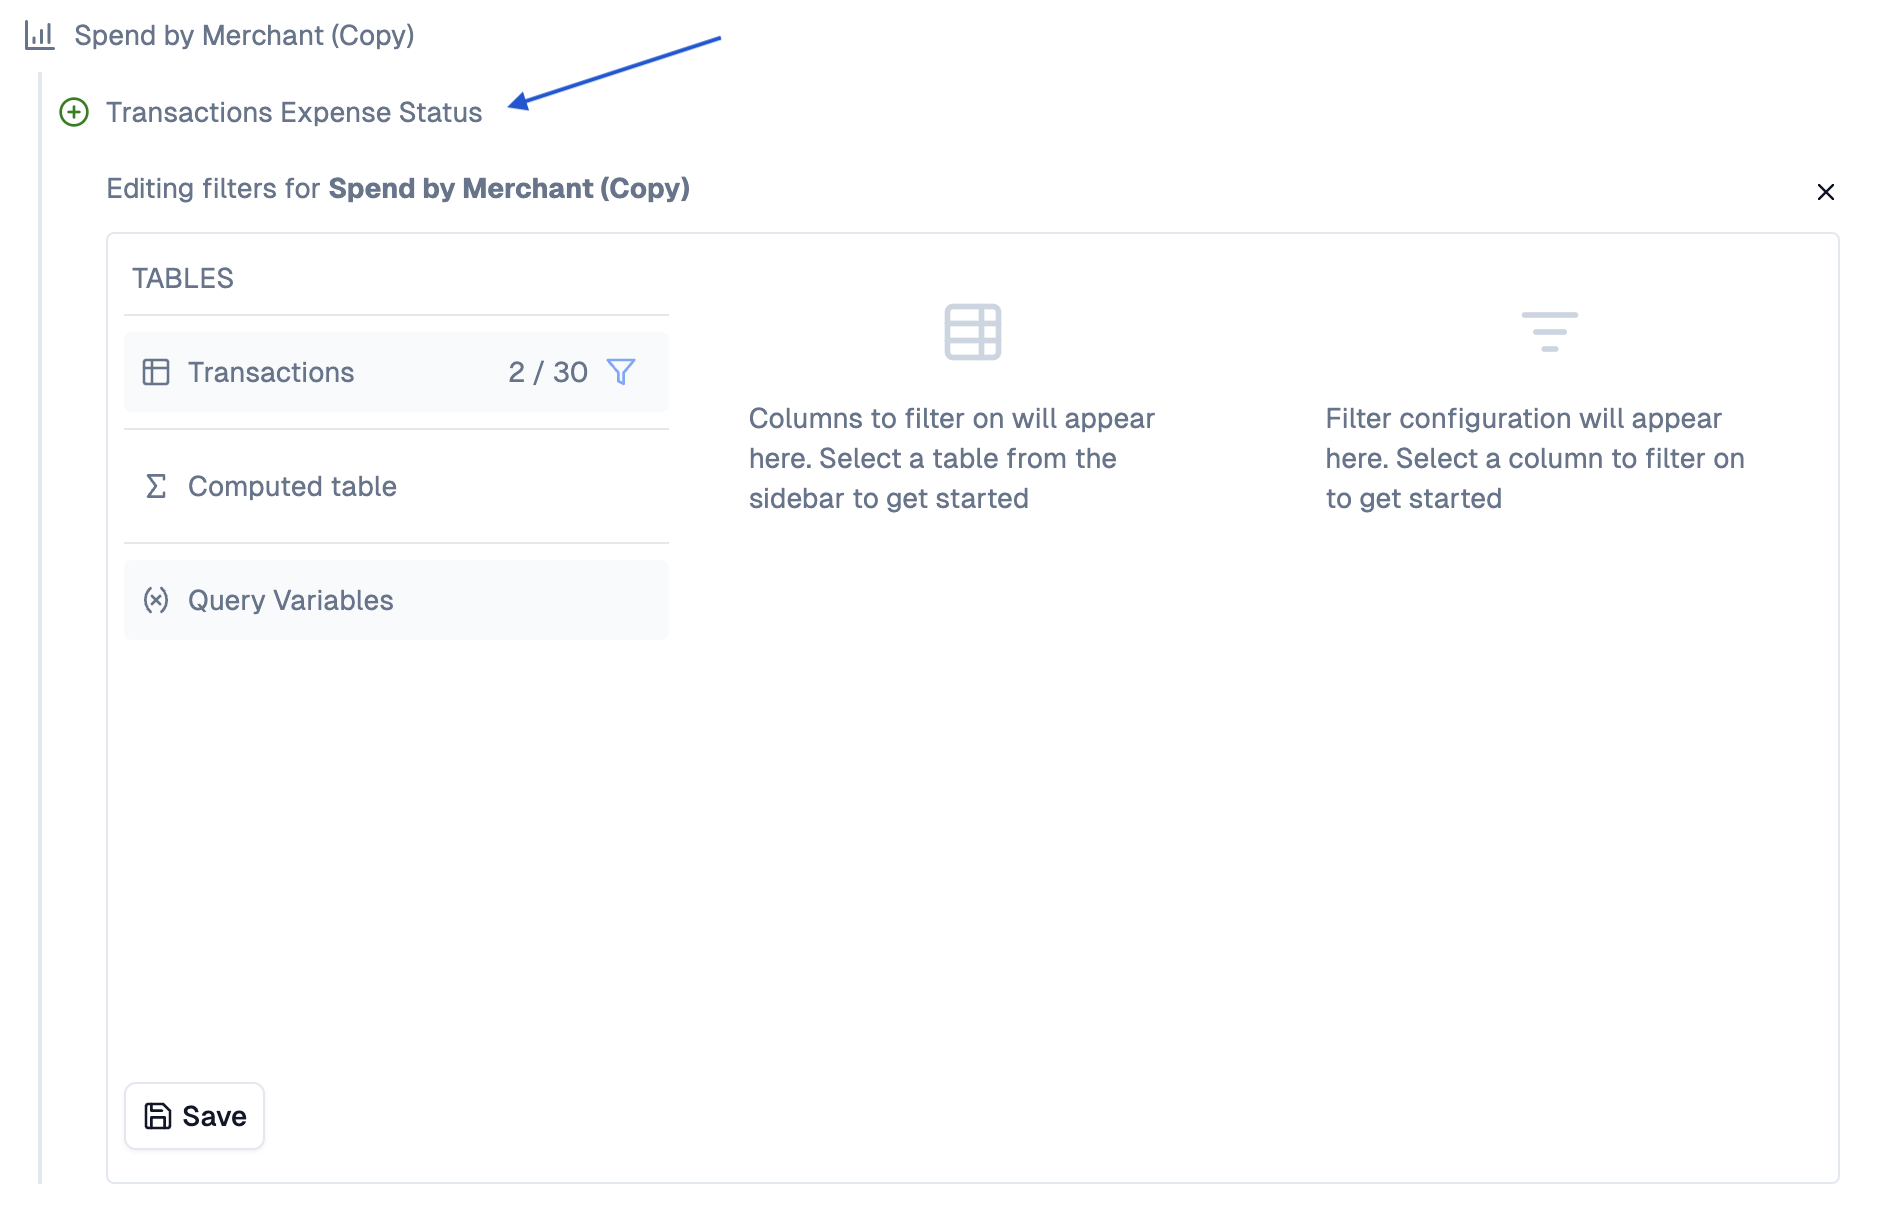
 Add the filter and hit `Save` to make sure it's added. You will see the filter show up above the panel you are in with a green **(+)** icon. Note that if this filter was not configured as a `Select` filter, it would not appear in this case. This is because chart filters are only shown if they match the dashboard filter type exactly.
 You may now click the **green (+) icon** to add this newly configured chart filter to the target list of this filter
 Finally, use the filter preview to confirm that everything is working as expected.
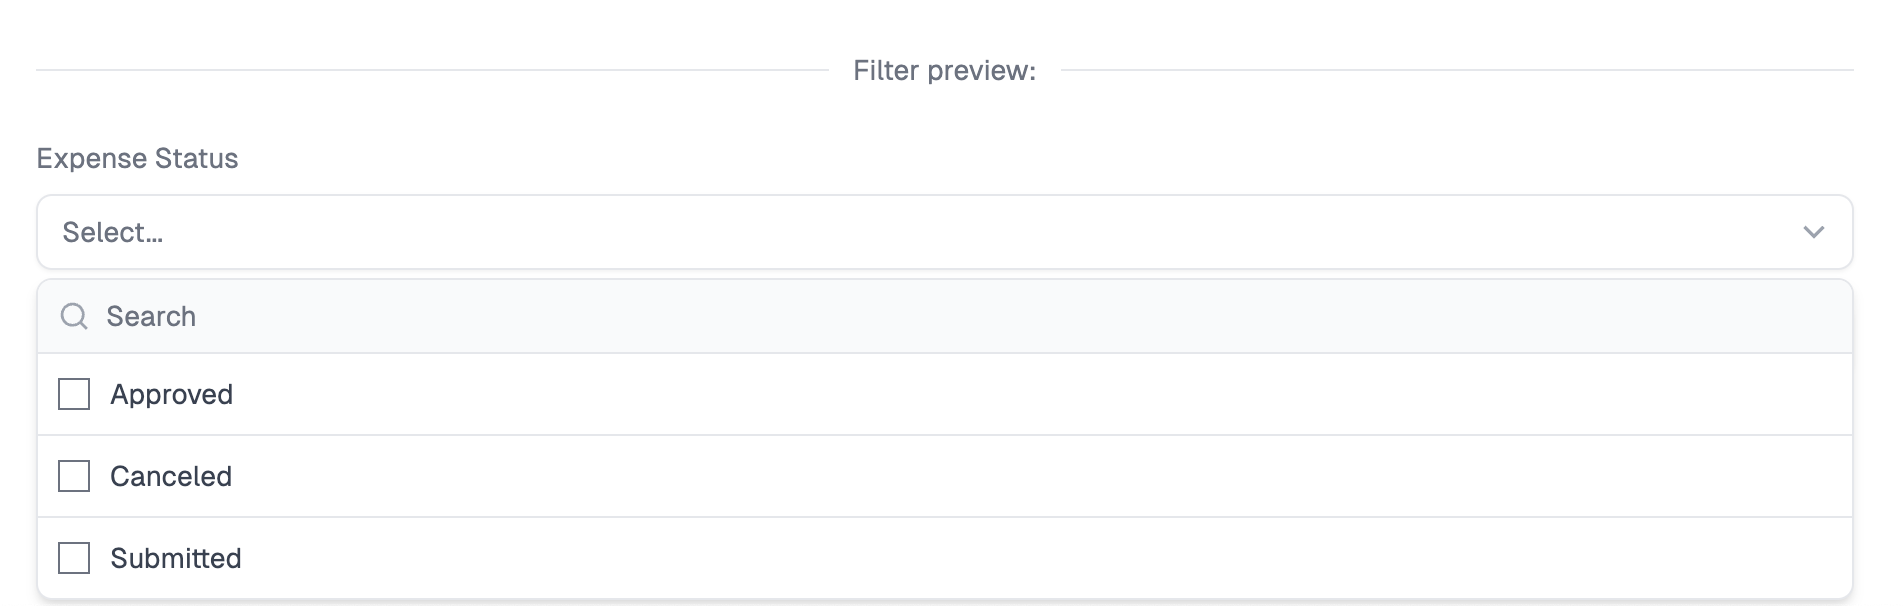 Ther filter may now be set on the dashboard level. Note that all charts that the filter is connected to are filtered.