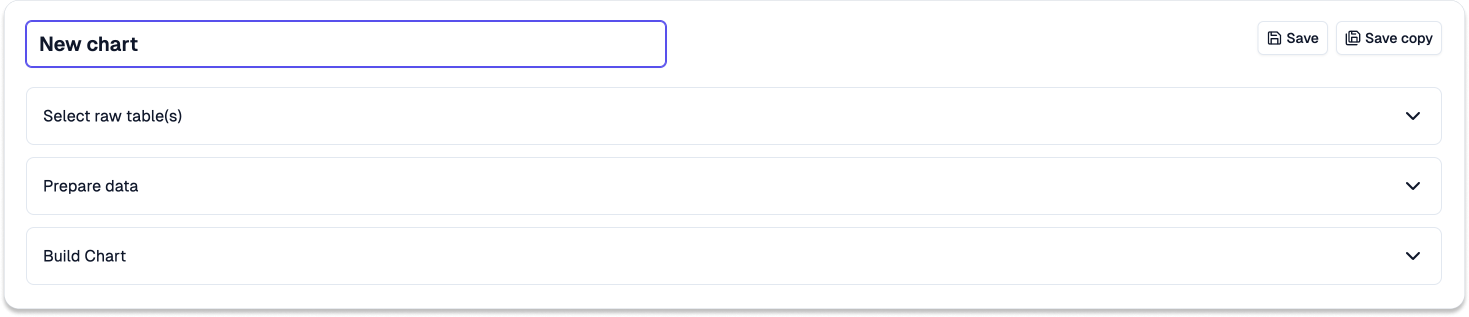
Building a Chart via Point and Click
It requires four steps to build a chart:1. Select raw table(s)
1. Select raw table(s)
Search and select the relevant raw table(s) needed for visulizing data in your chart.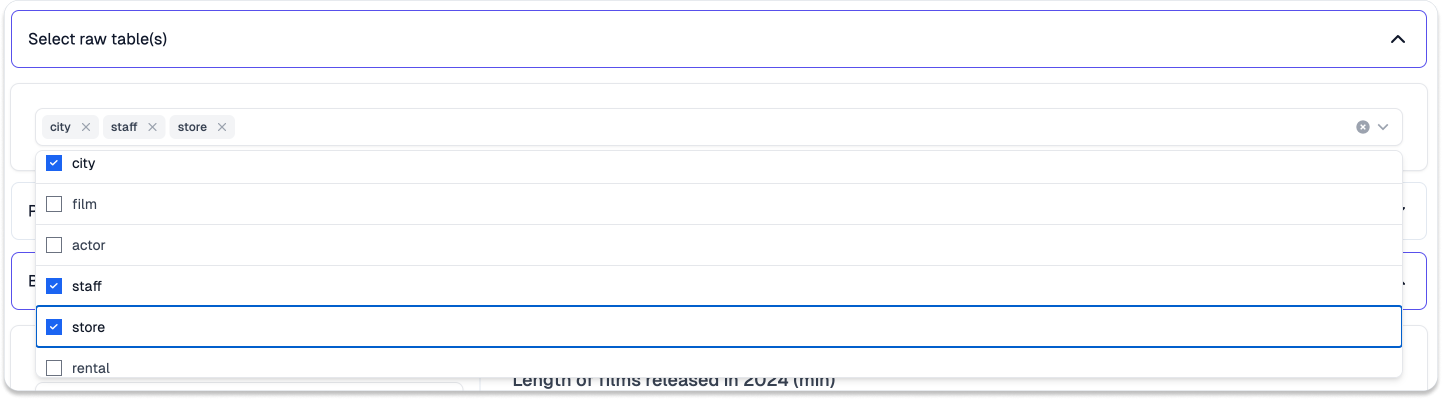
2. Prepare data
2. Prepare data
Input the relevant SQL to prepare the raw data for data visulization and click
Run query to execute the code.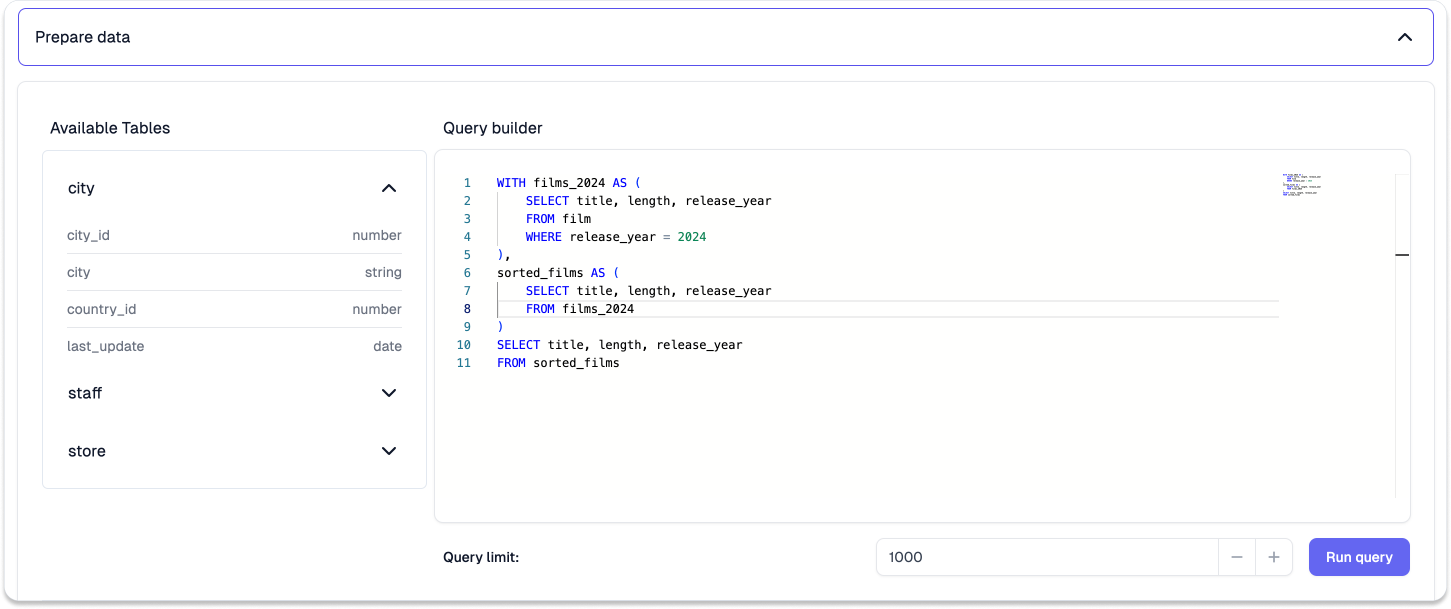
3. Build chart
3. Build chart
Select the relevant chart type, and choose the corresponding x- & y-axis
columns for the charting. See Chart
Configuration for settings to tailor your
chart. Click Save when you are happy with your chart. You could also
create a copy of the chart by clicking Save copy.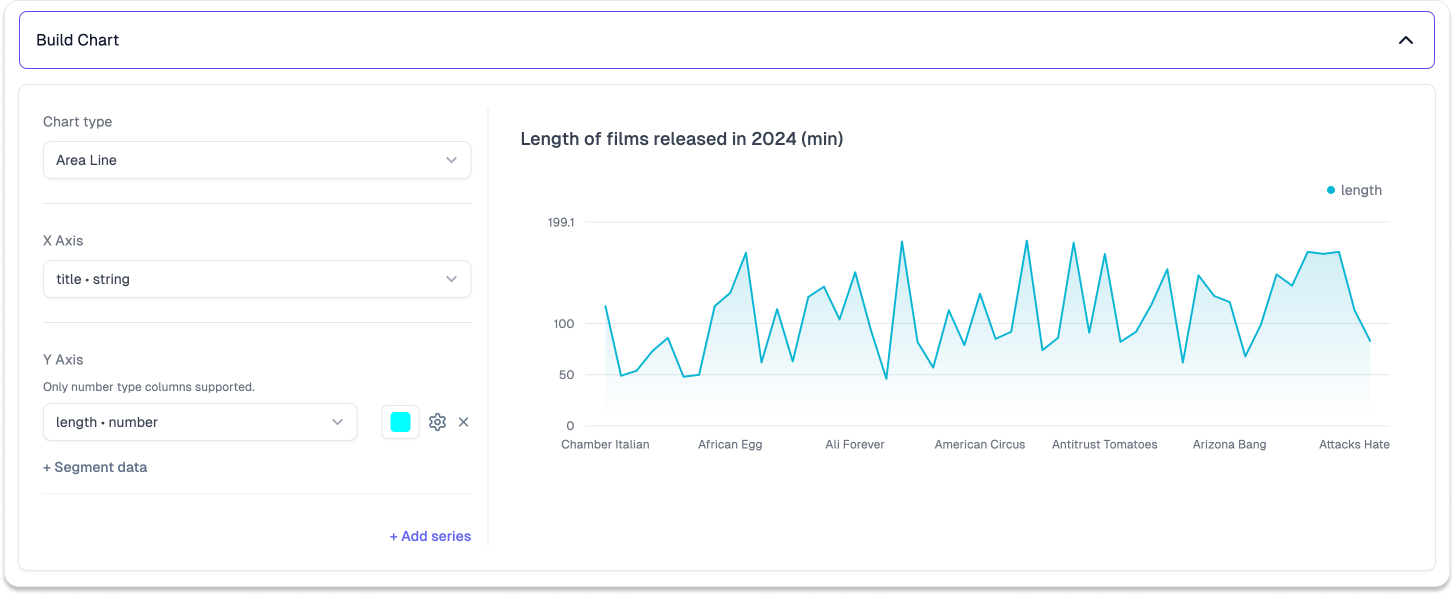
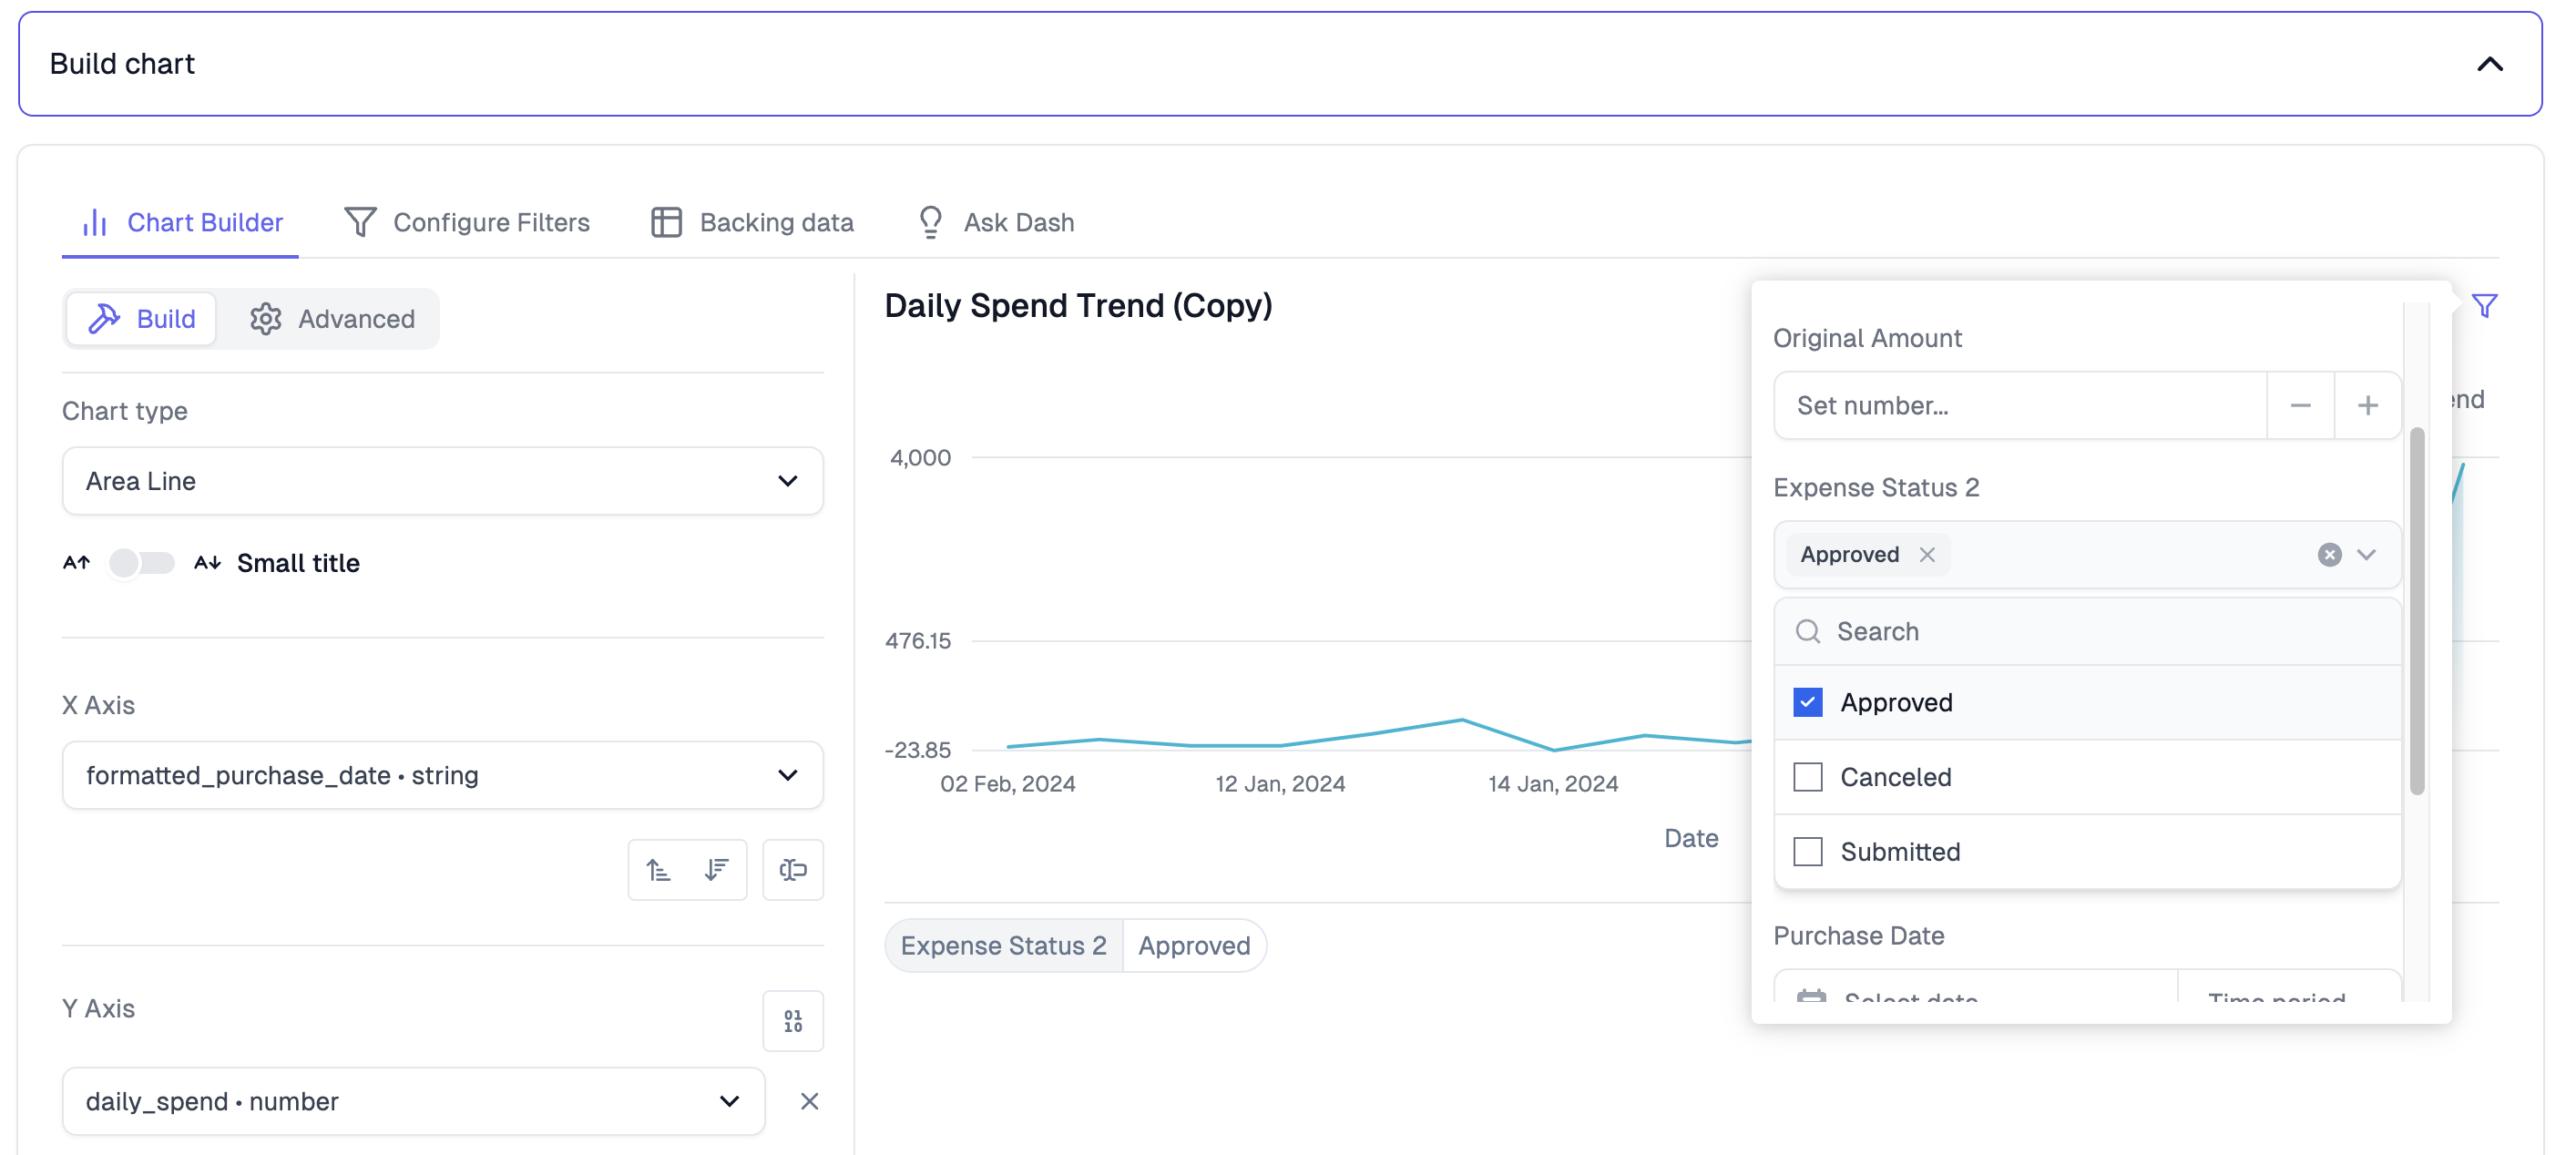
4. Configure filters
4. Configure filters
It is now possible to configure chart-level filters, for columns you expect users to interact with. For a more comprehensive overview, check out our in-depth filtering guide.