Documentation IndexFetch the complete documentation index at: /llms.txtUse this file to discover all available pages before exploring further.
Fetch the complete documentation index at: /llms.txt
Use this file to discover all available pages before exploring further.
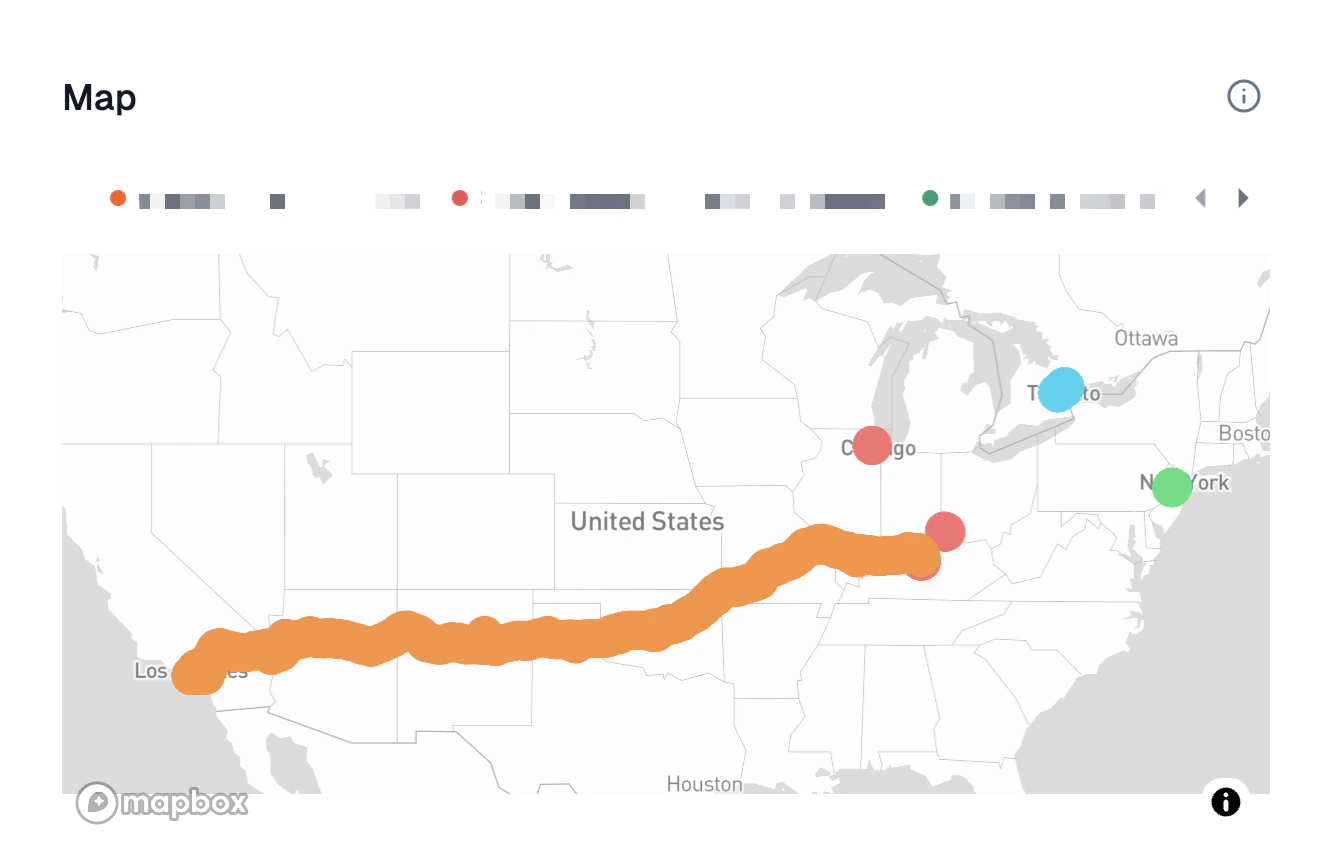
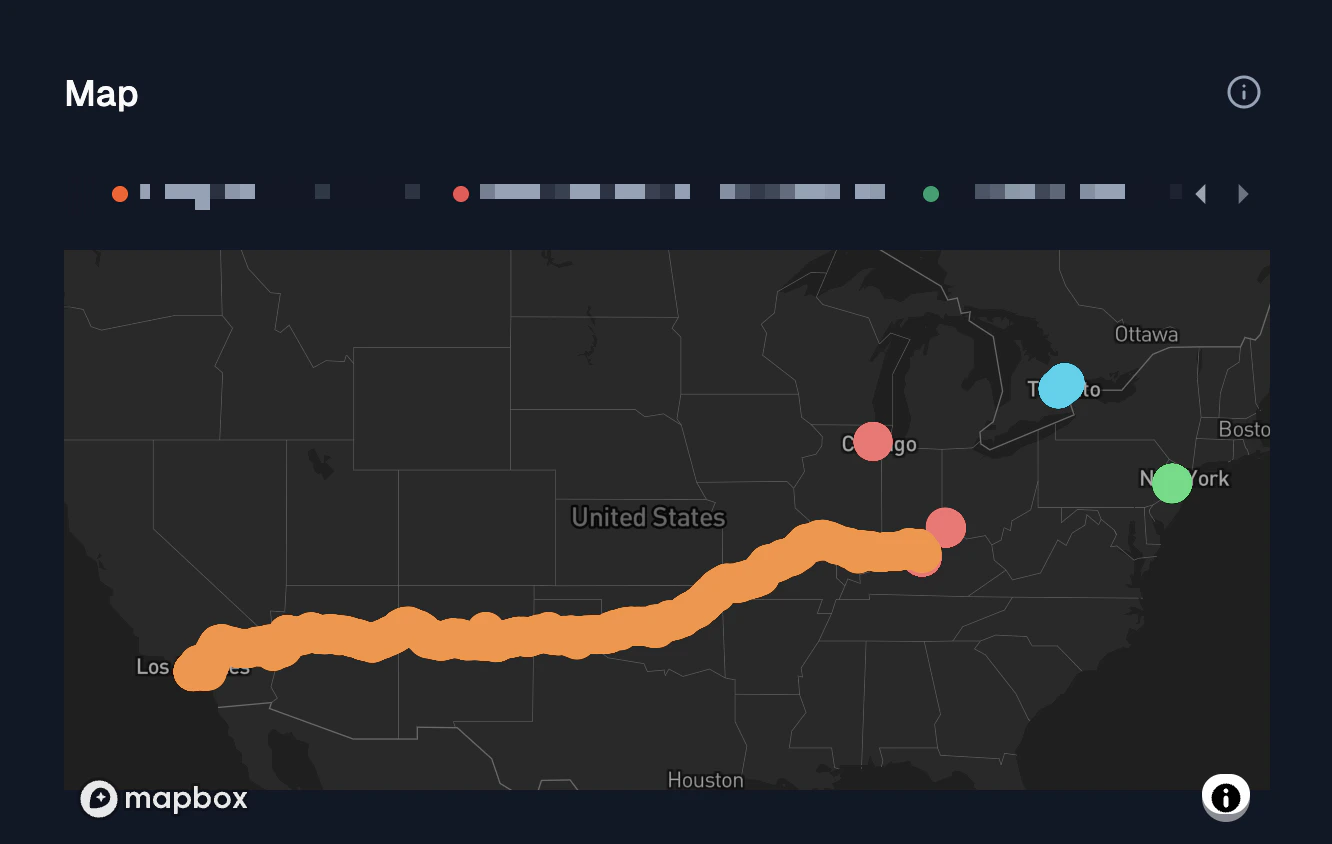
Use geographical maps to represent information tied to specific locations or regions
Was this page helpful?