Documentation IndexFetch the complete documentation index at: /llms.txtUse this file to discover all available pages before exploring further.
Fetch the complete documentation index at: /llms.txt
Use this file to discover all available pages before exploring further.
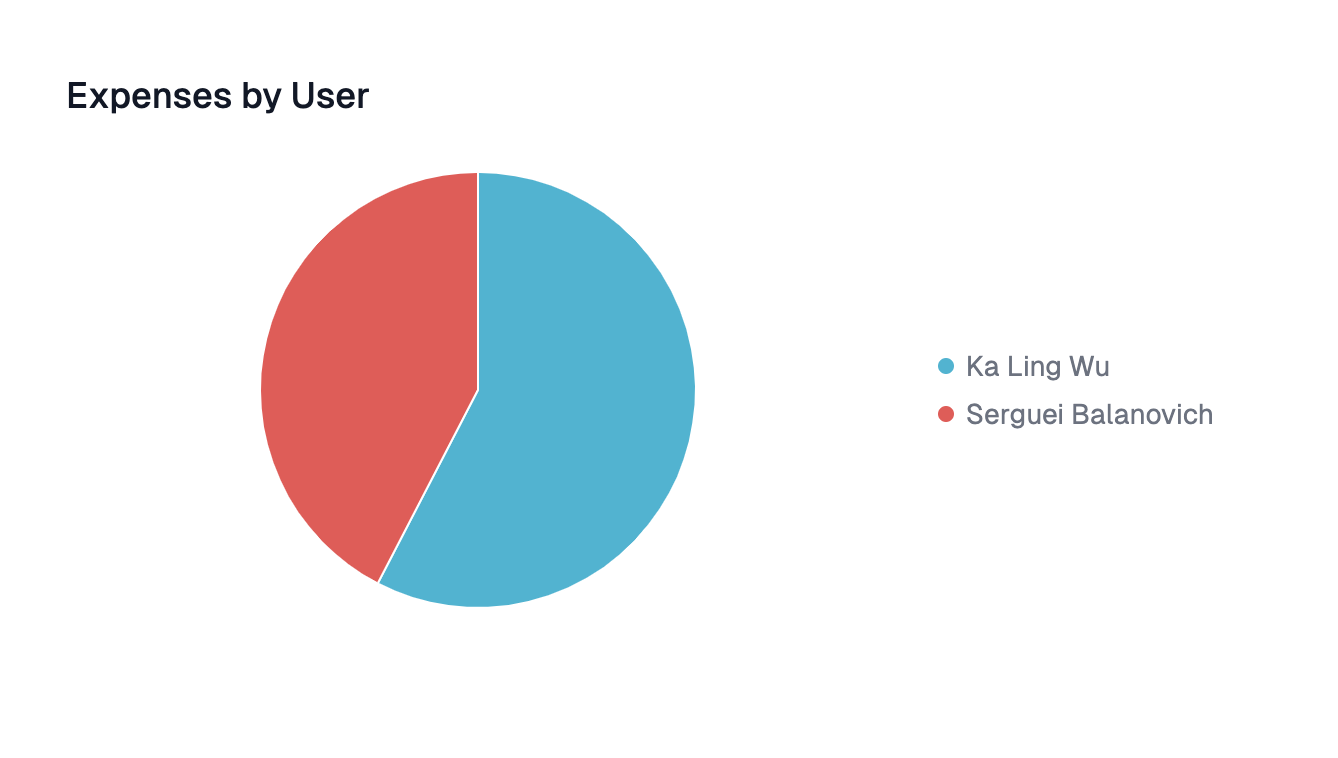
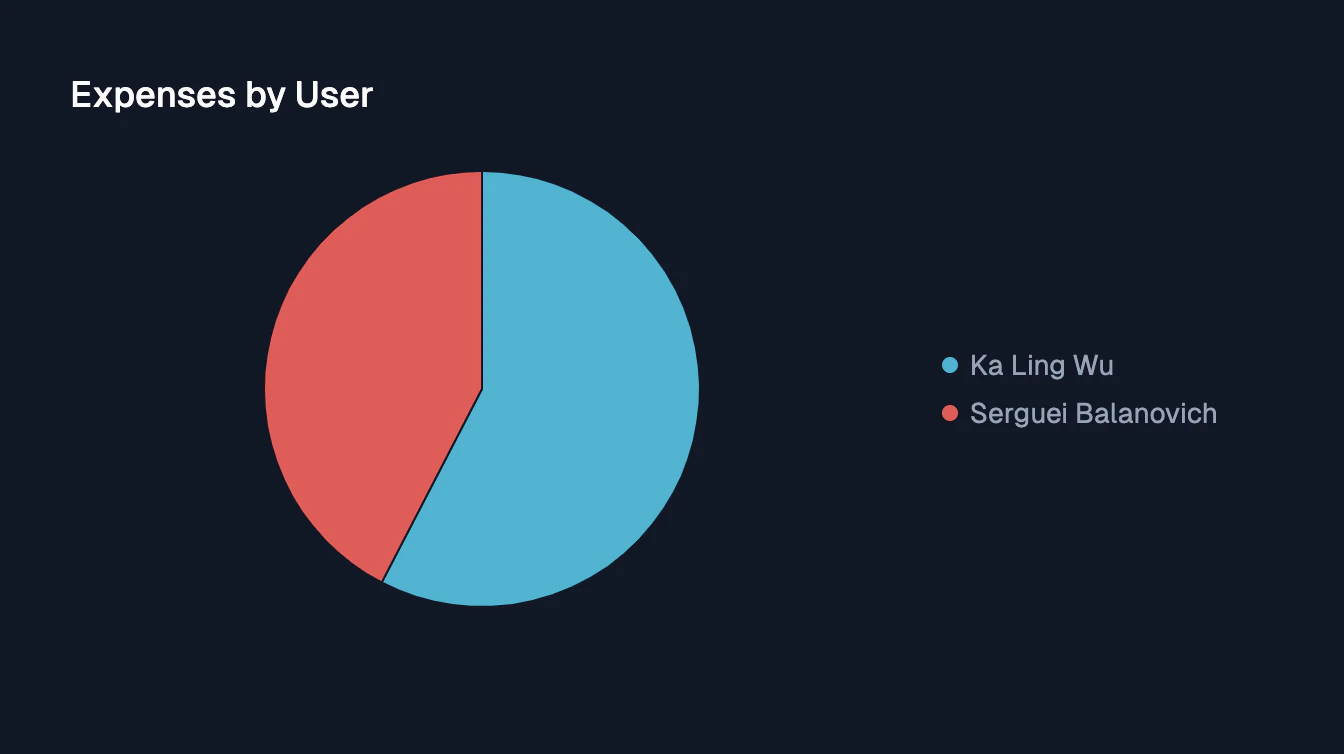
Shows proportional data and the relative sizes of parts to a whole as a circular graph
Was this page helpful?