Documentation IndexFetch the complete documentation index at: /llms.txtUse this file to discover all available pages before exploring further.
Fetch the complete documentation index at: /llms.txt
Use this file to discover all available pages before exploring further.
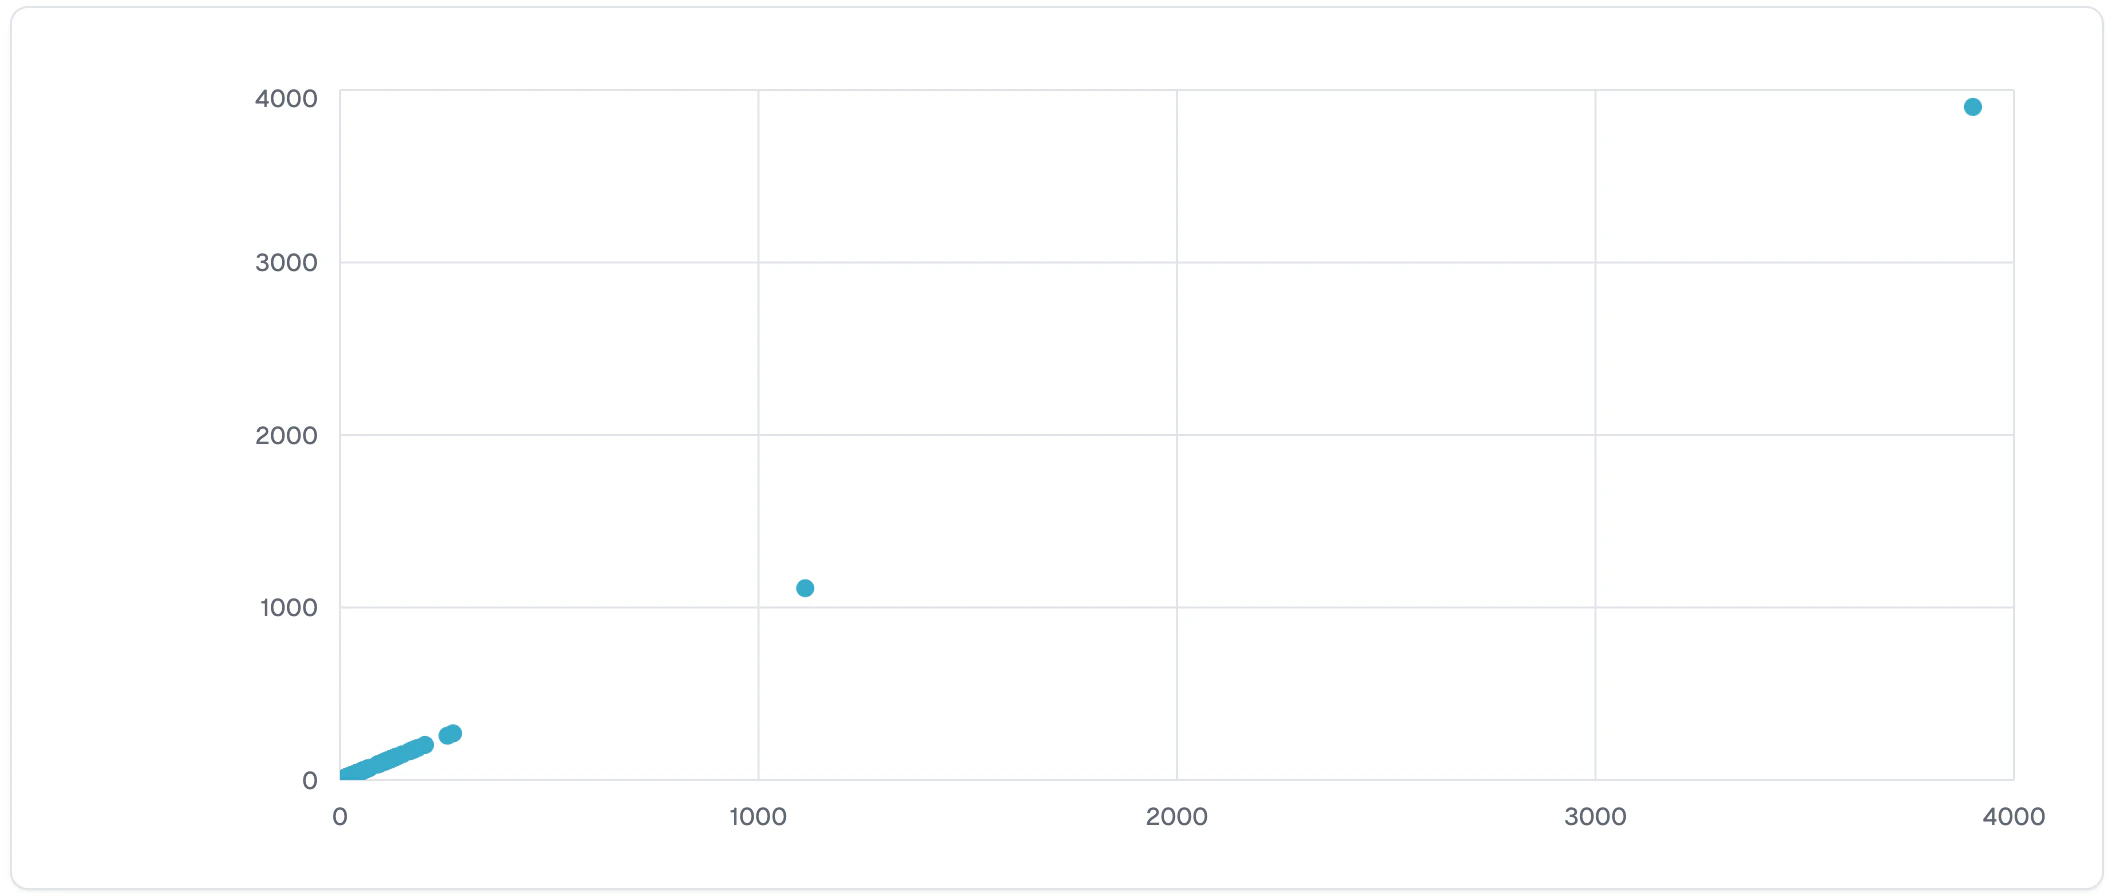
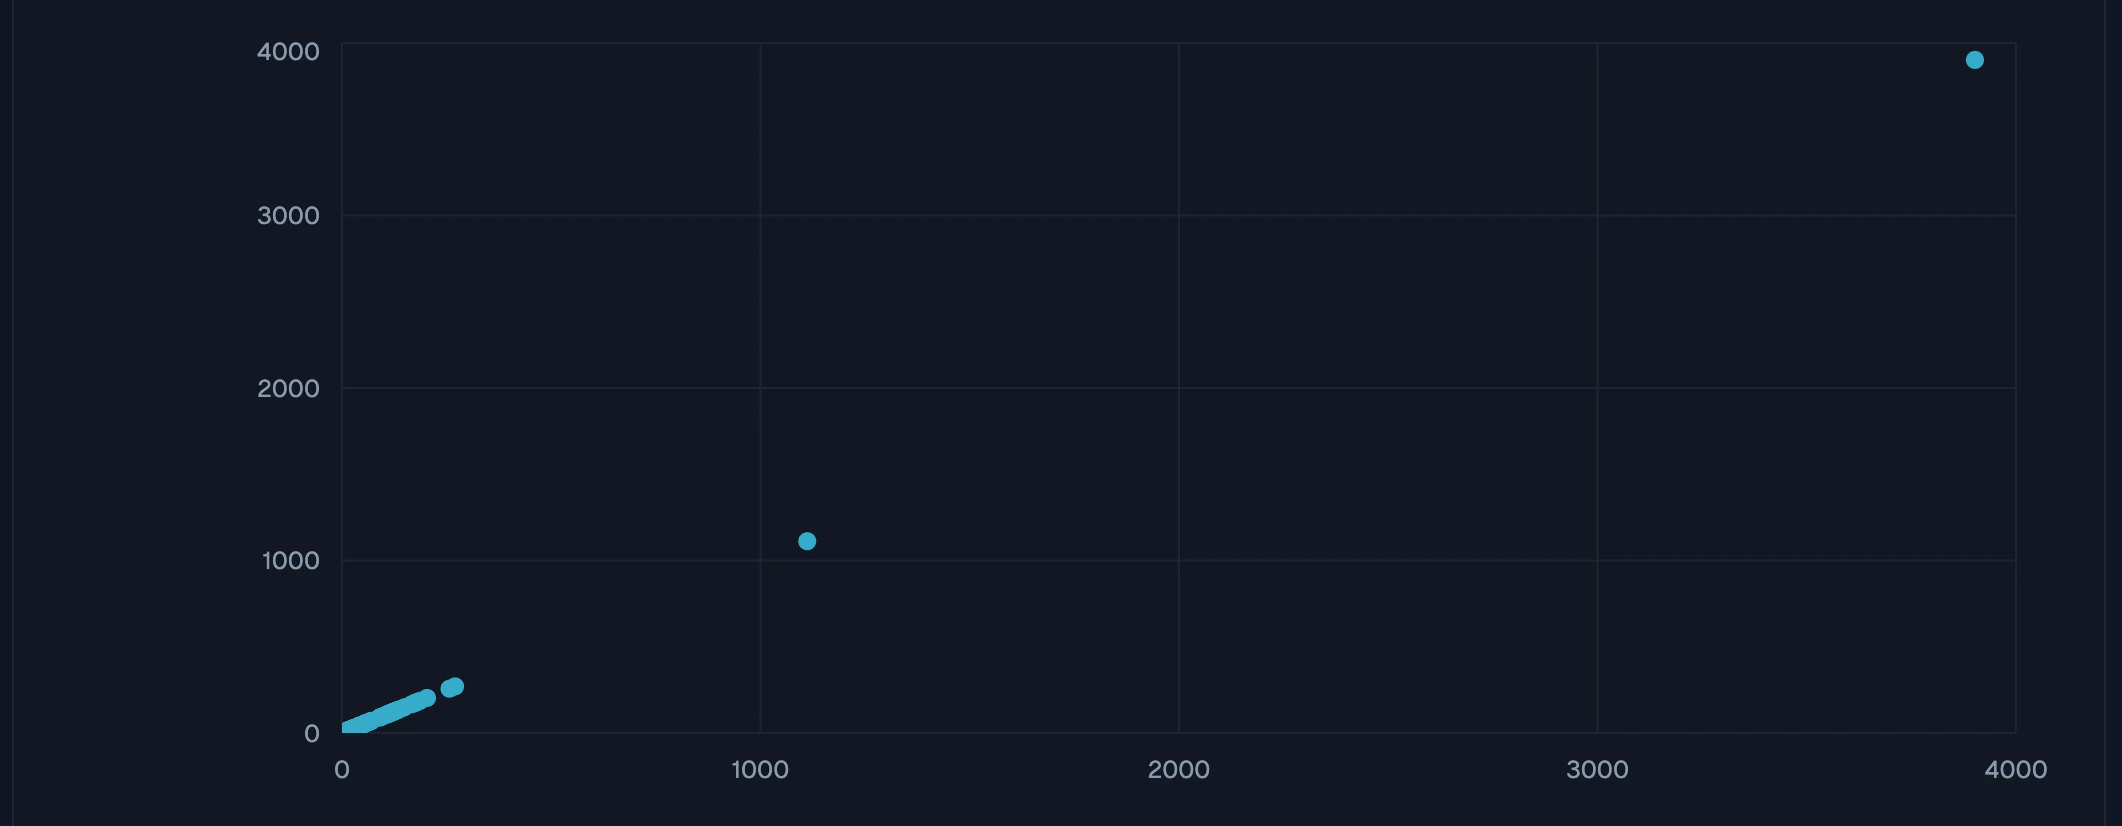
Represent the relationship between two numerical variables. Each data point is plotted as a dot on a Cartesian coordinate system
Was this page helpful?