Configuration
string or numeric
required
Category to group the chart by
numeric
required
Column to aggregate the bar chart on. You could select multiple columns by Add Series
Divides series into meaningful subgroups. The data in each subgroups can then be aggregated via one of
Distinct count, Count, Sub, Average, Min, MaxThe direction of bars could be set as
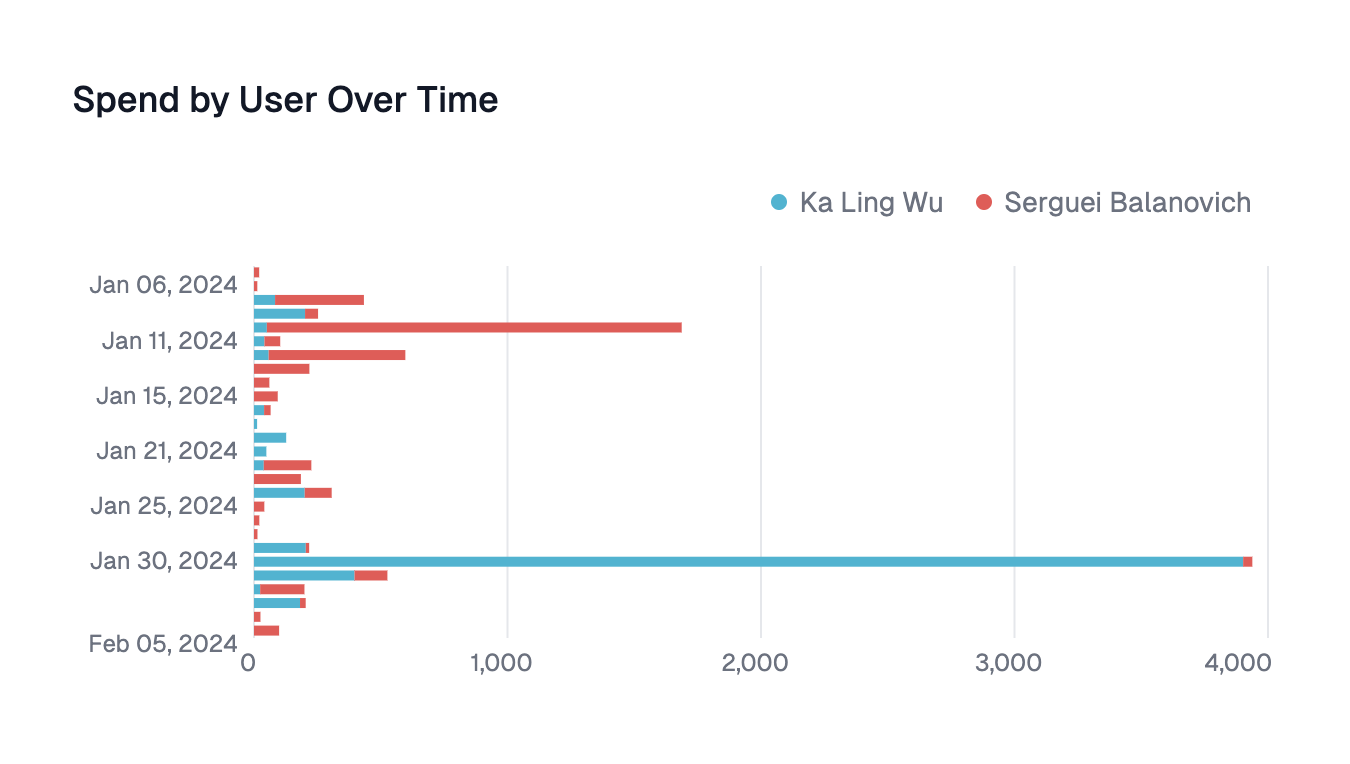
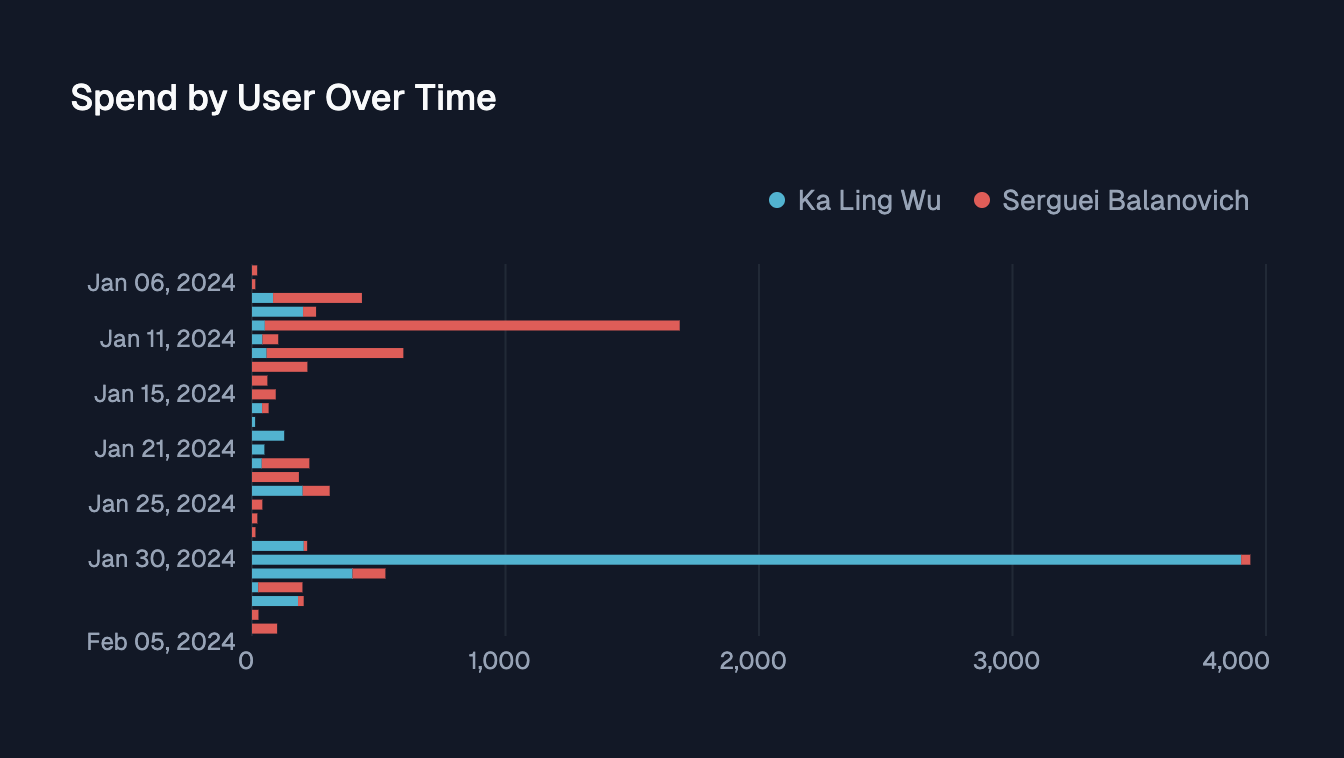
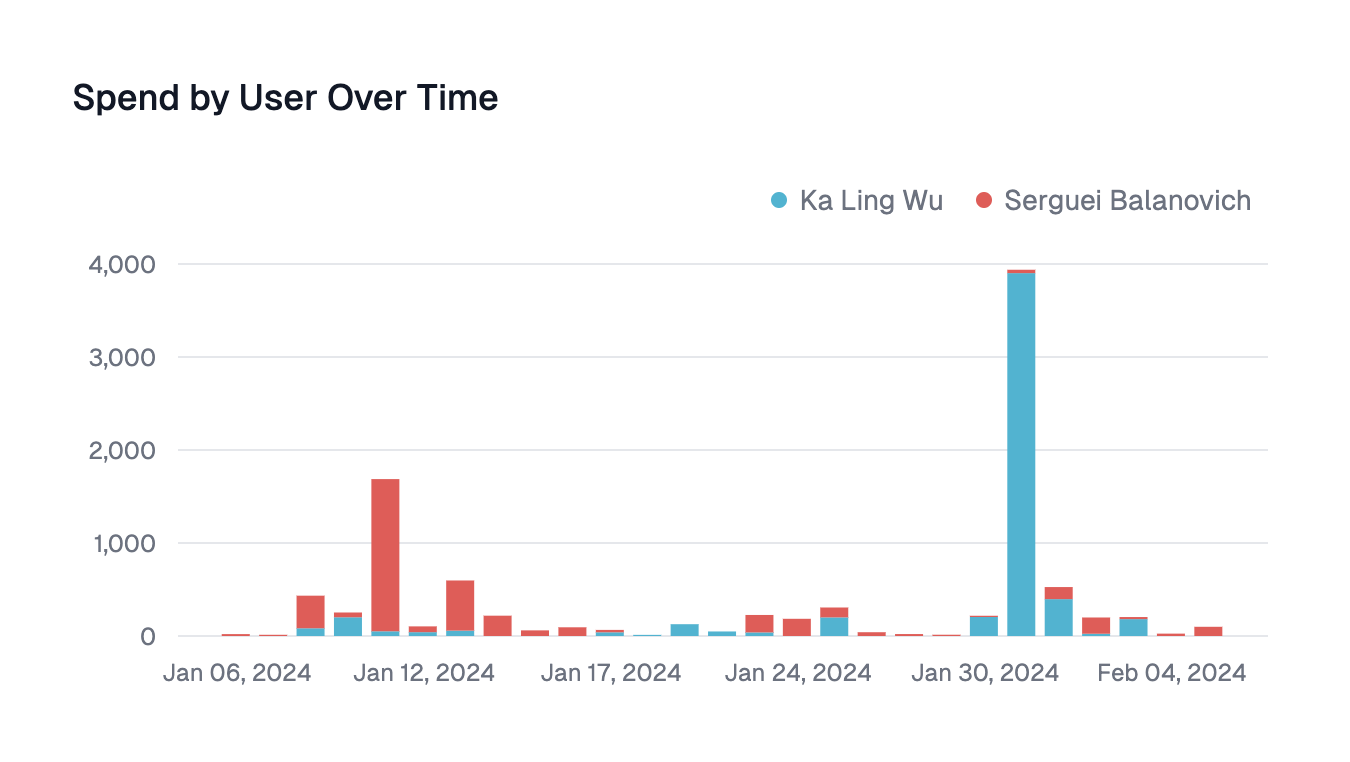
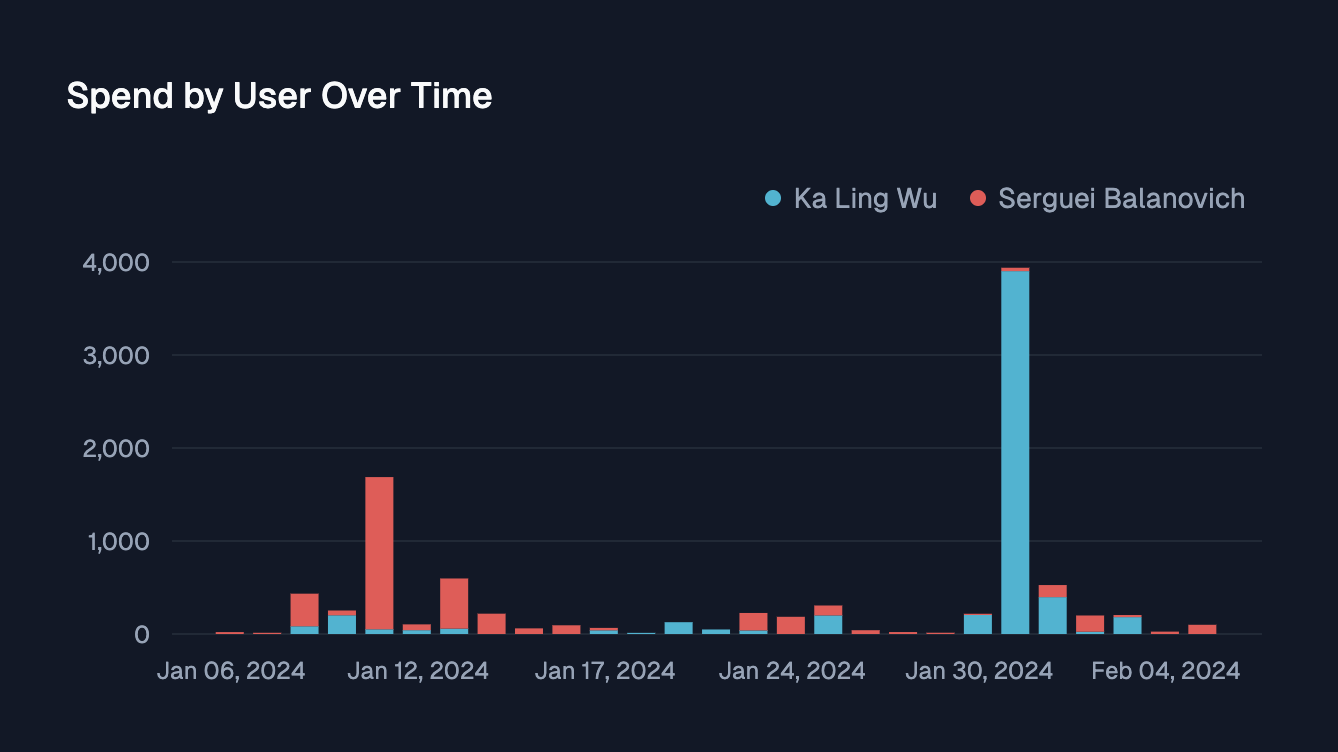
vertical or horizontal