Building a Dashboard via Point and Click
When you are in Edit Dashboard mode (navigable via the side navigation bar when you are previewing a dashboard), you could edit the dashboard via Add chart or Add filter.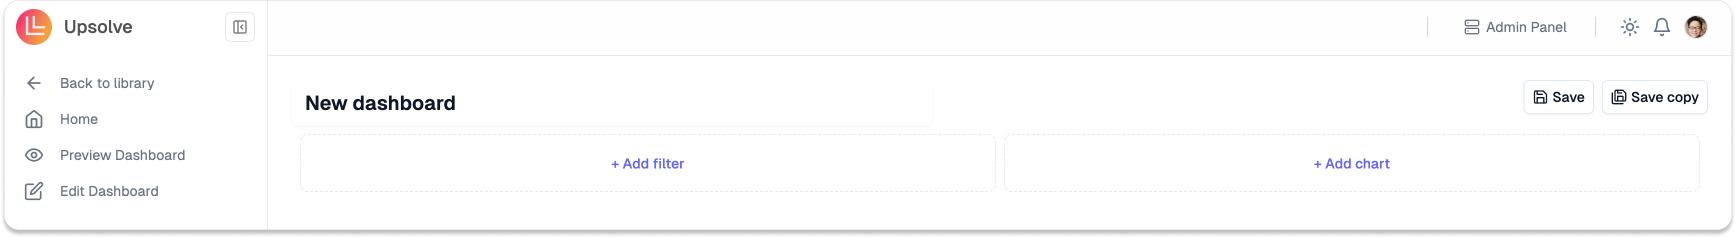
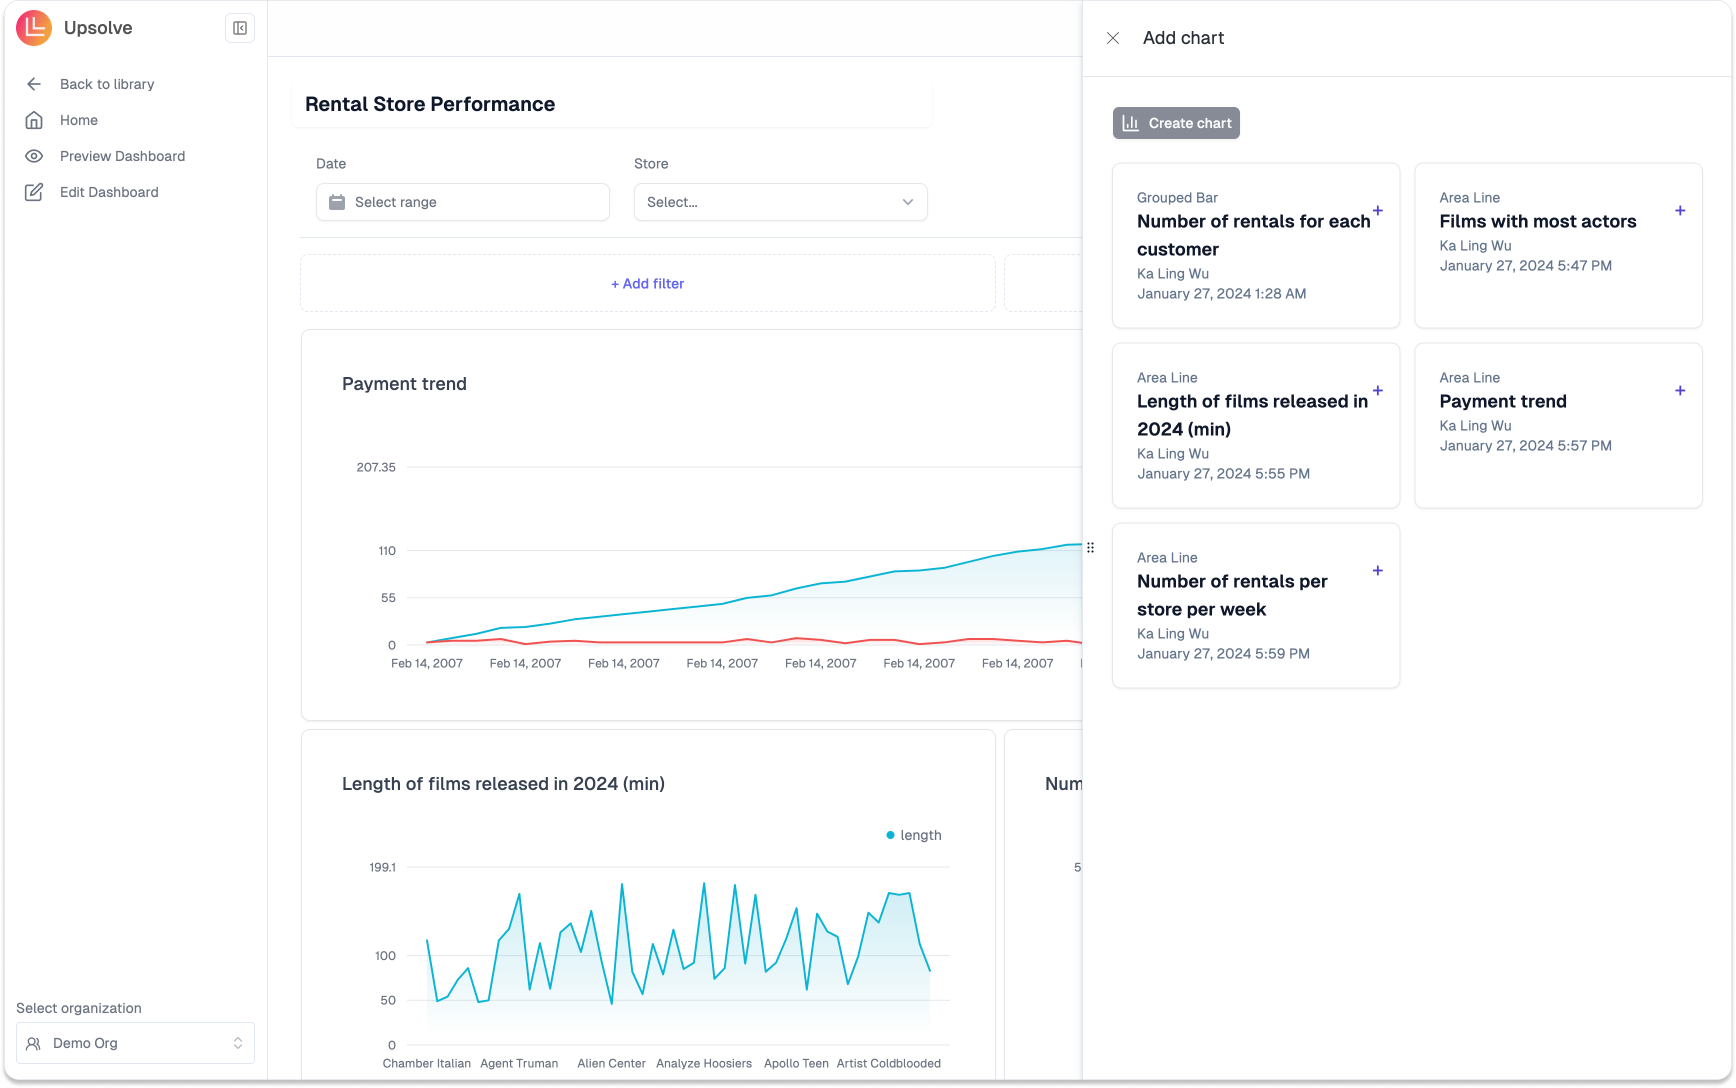
Add Dashboard
When you click Add chart, a right-hand-side panel will slide out and you can pick charts from your library to add them to the dashboard. After you have added a chart to the dashboard, you could move the chart in the dashbaord canvas if you hover to the top center of the chart. You could also change the size of the chart by hoverig over the bottom right corner of the chart, then click and drag to change the chart size.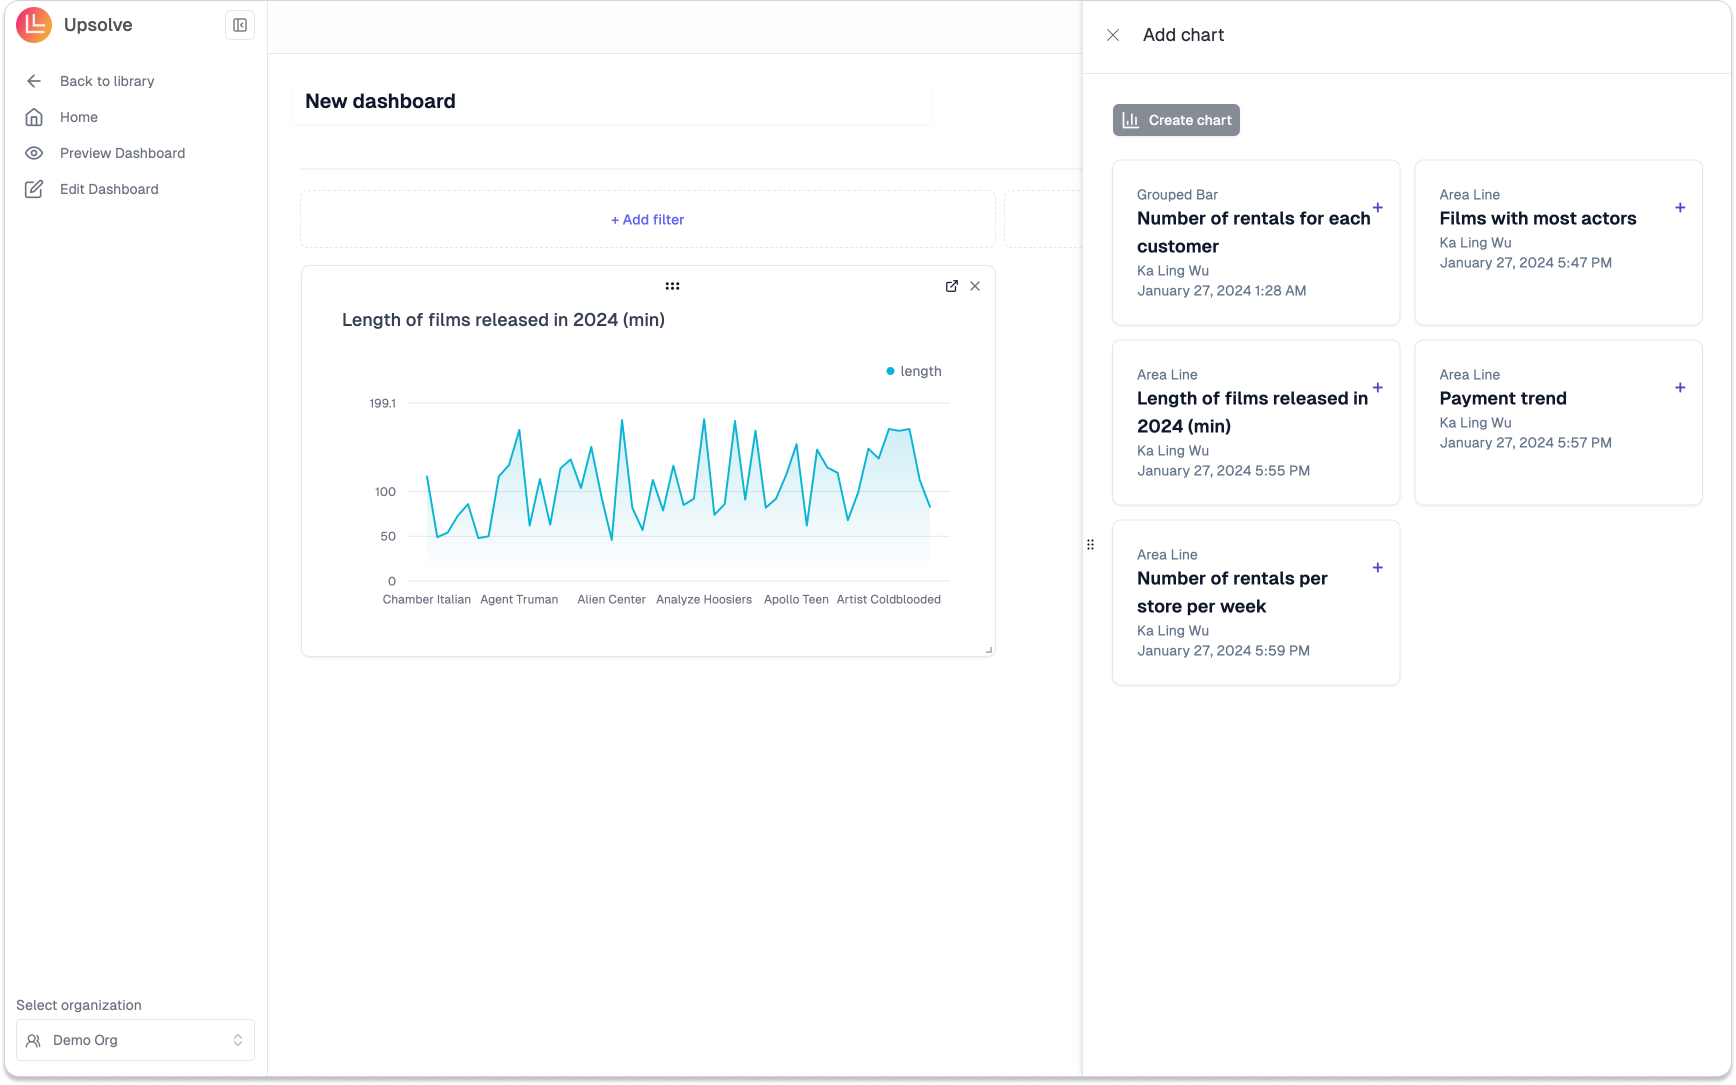
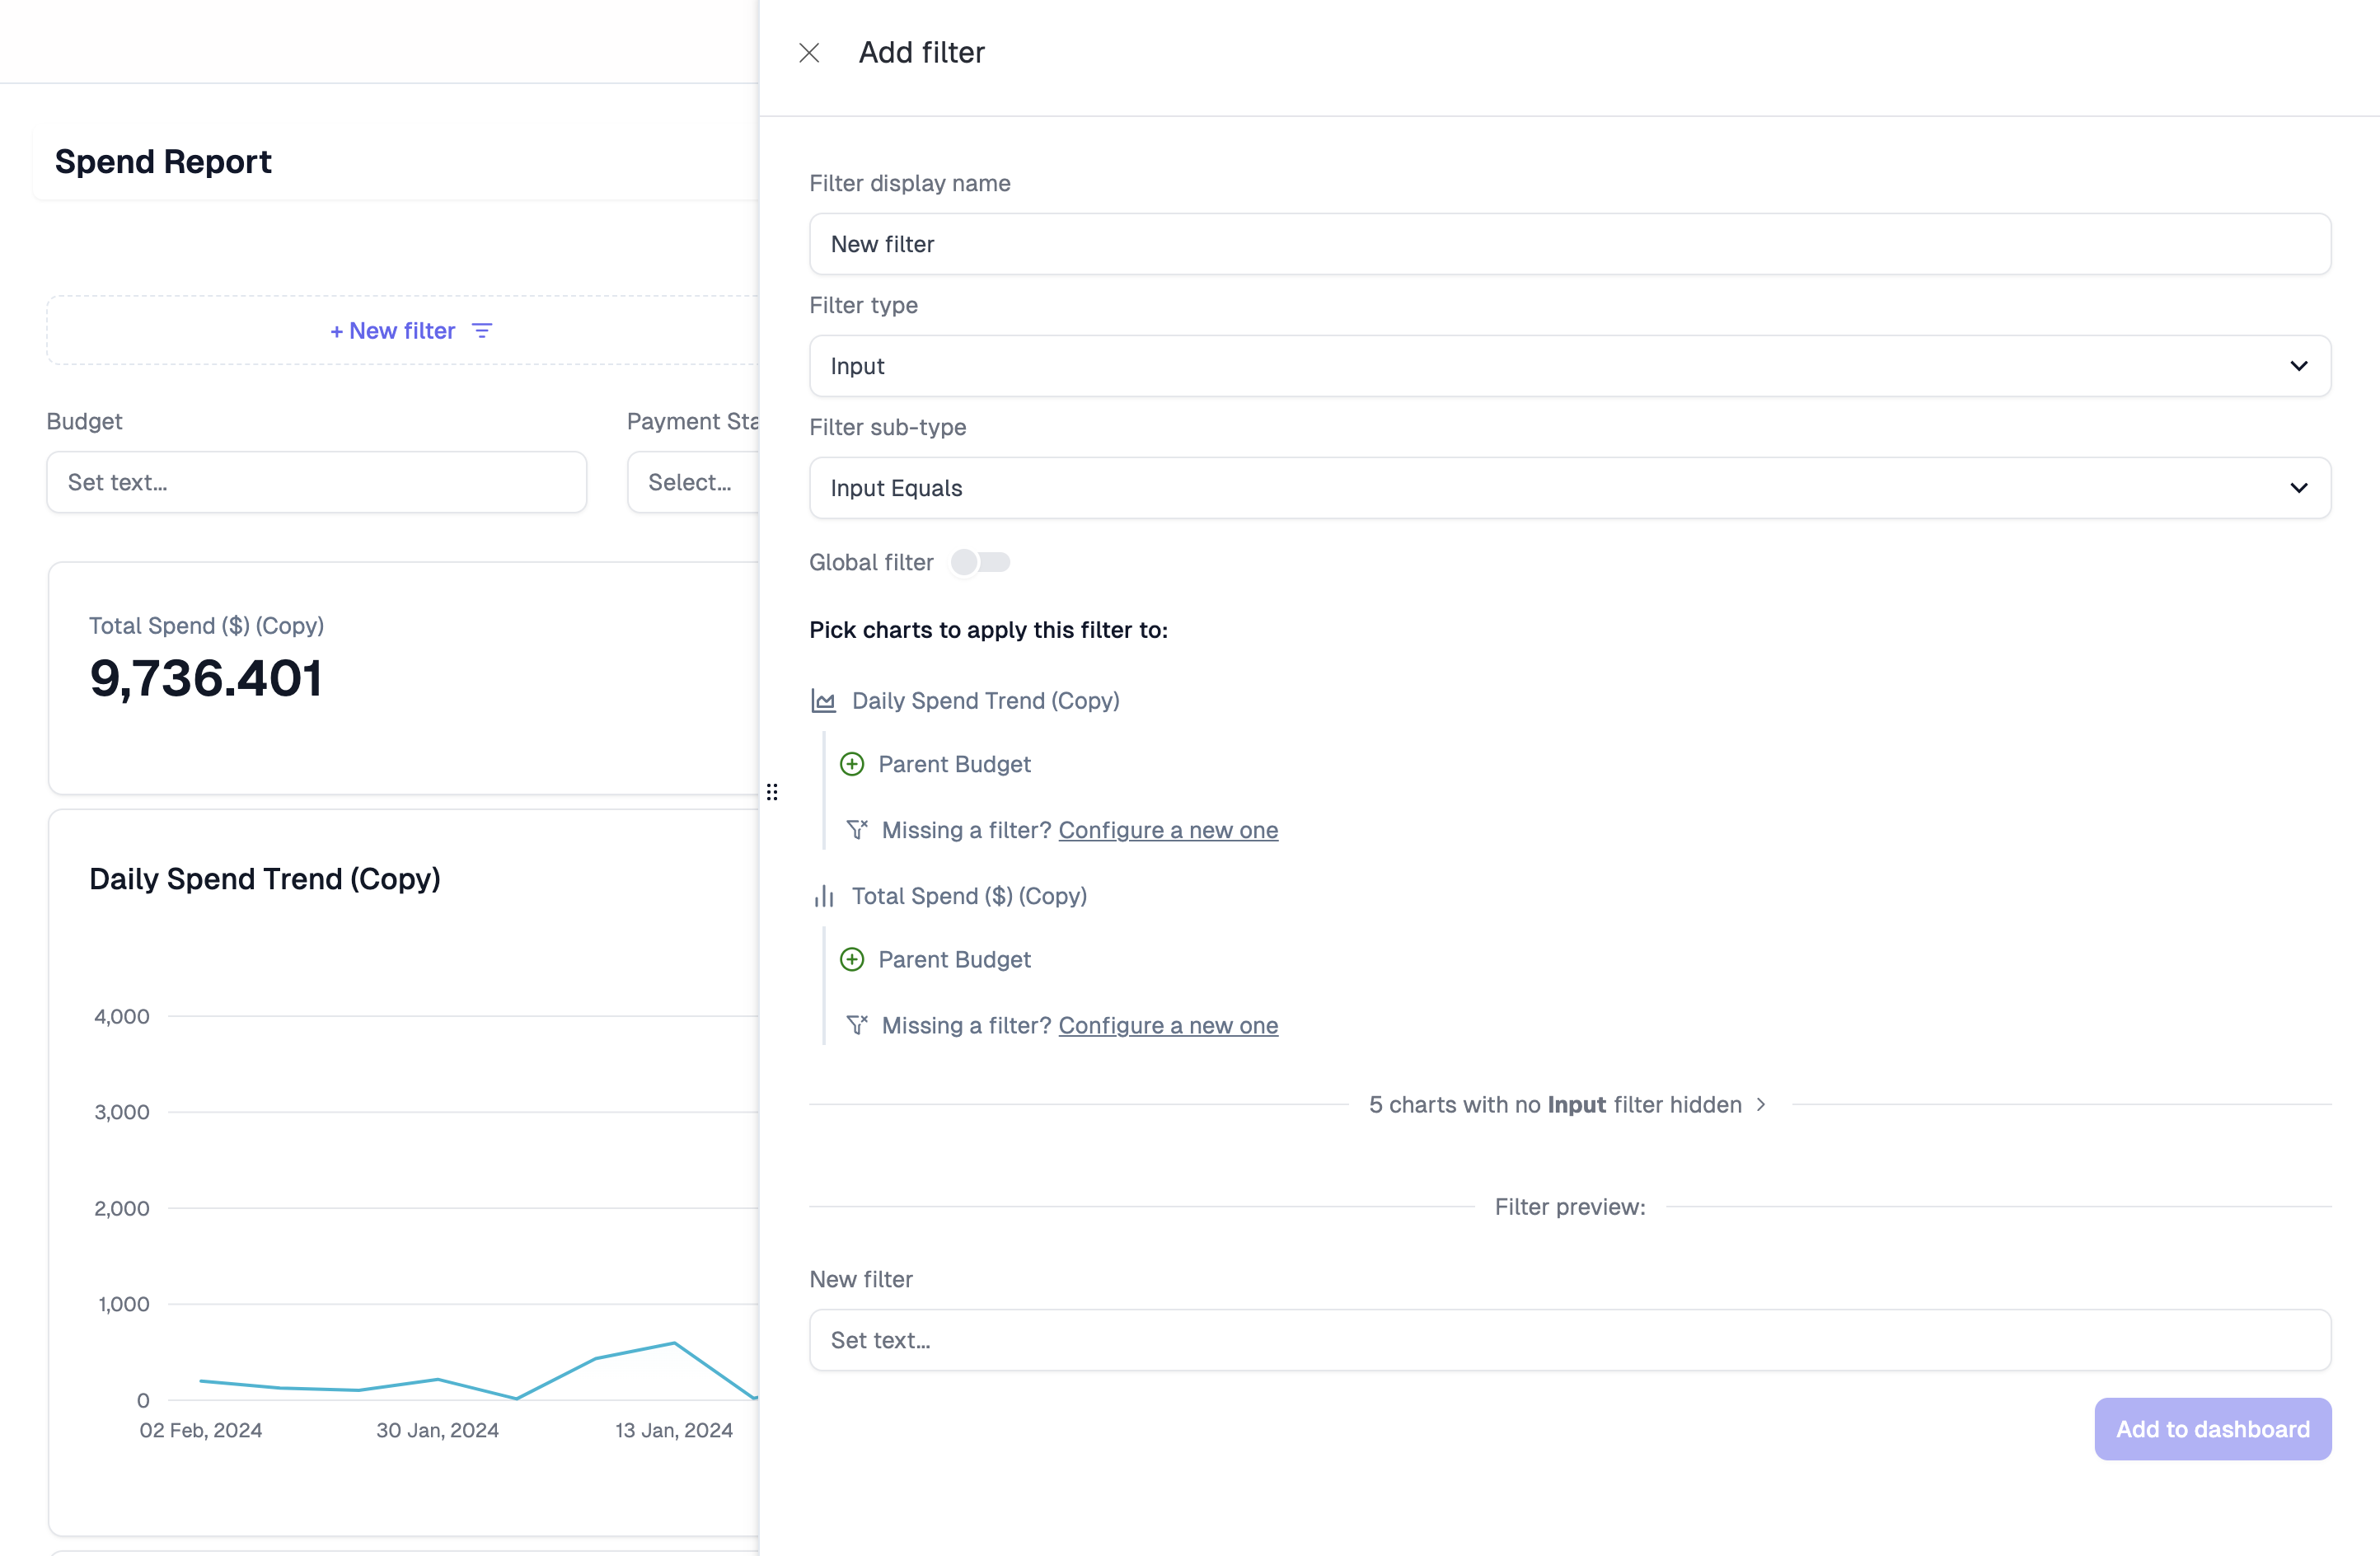
Add Filter
For a more comprehensive overview, check out our in-depth filtering guide. Adding filters allows you and your end-users to be able to interact with the dashboard in an intuitive manner. When you click Add filter, a right-hand-side panel will slide out and you can configure new filter accordingly. You can configure the type and subtype of the filter, and the chart filters the filter should pas its values through to.