Overview
Many databases store semi-structured data in JSON columns. JSON Column Parsing lets you expand these nested fields into separate, queryable columns - no ETL pipeline needed. Once activated, JSON properties appear as individual columns in your charts and filters. Before: A singlemetadata column containing {"region": "US", "plan": "pro", "mrr": 450}
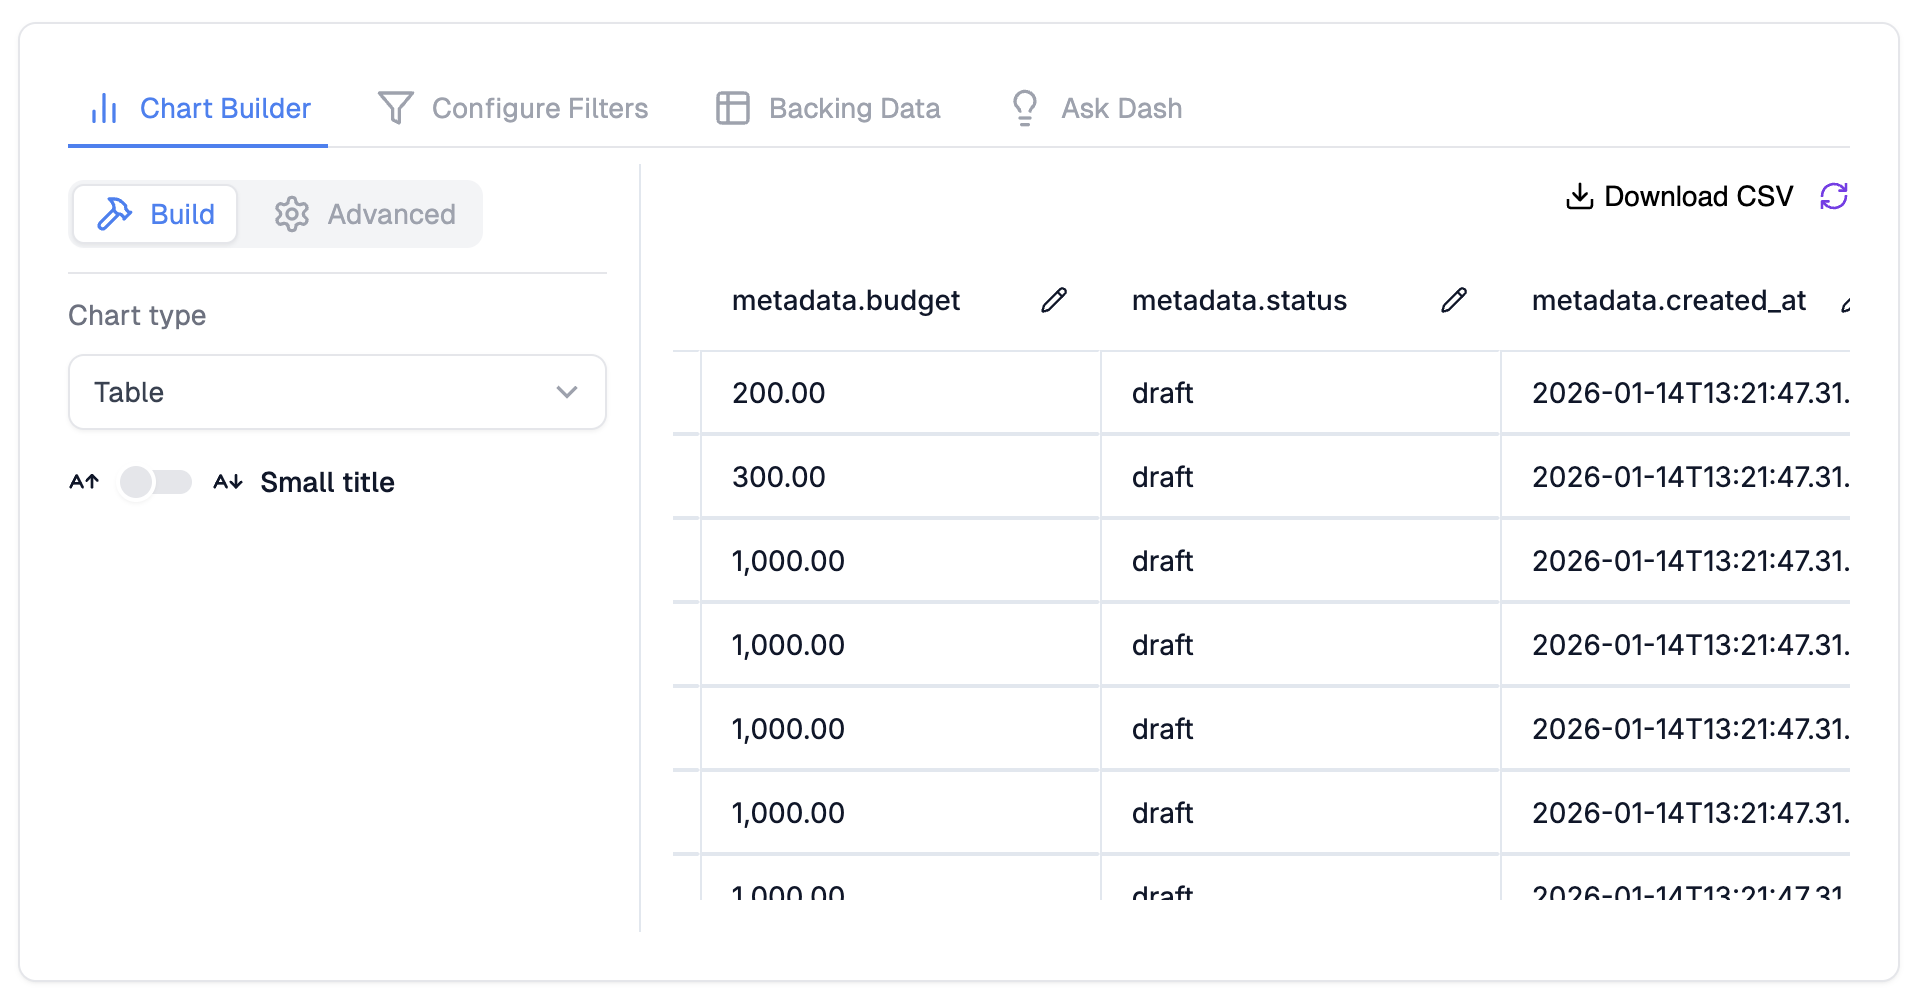
After: Three separate columns - metadata.region, metadata.plan, metadata.mrr - each usable in axes, filters, and groupings.
Supported Databases
JSON parsing works with Postgres, BigQuery, ClickHouse, and databases connected via the Data Plane. The system generates the correct JSON extraction syntax for each database type automatically.Step 1: Recompute Connection Metadata
Before enabling JSON parsing, make sure your connection metadata is up to date.- Navigate to the Connections page
- Find the connection that contains your JSON columns
- Click Recompute Metadata
- Wait for the metadata refresh to complete

Step 2: Activate JSON Parsing on a Column
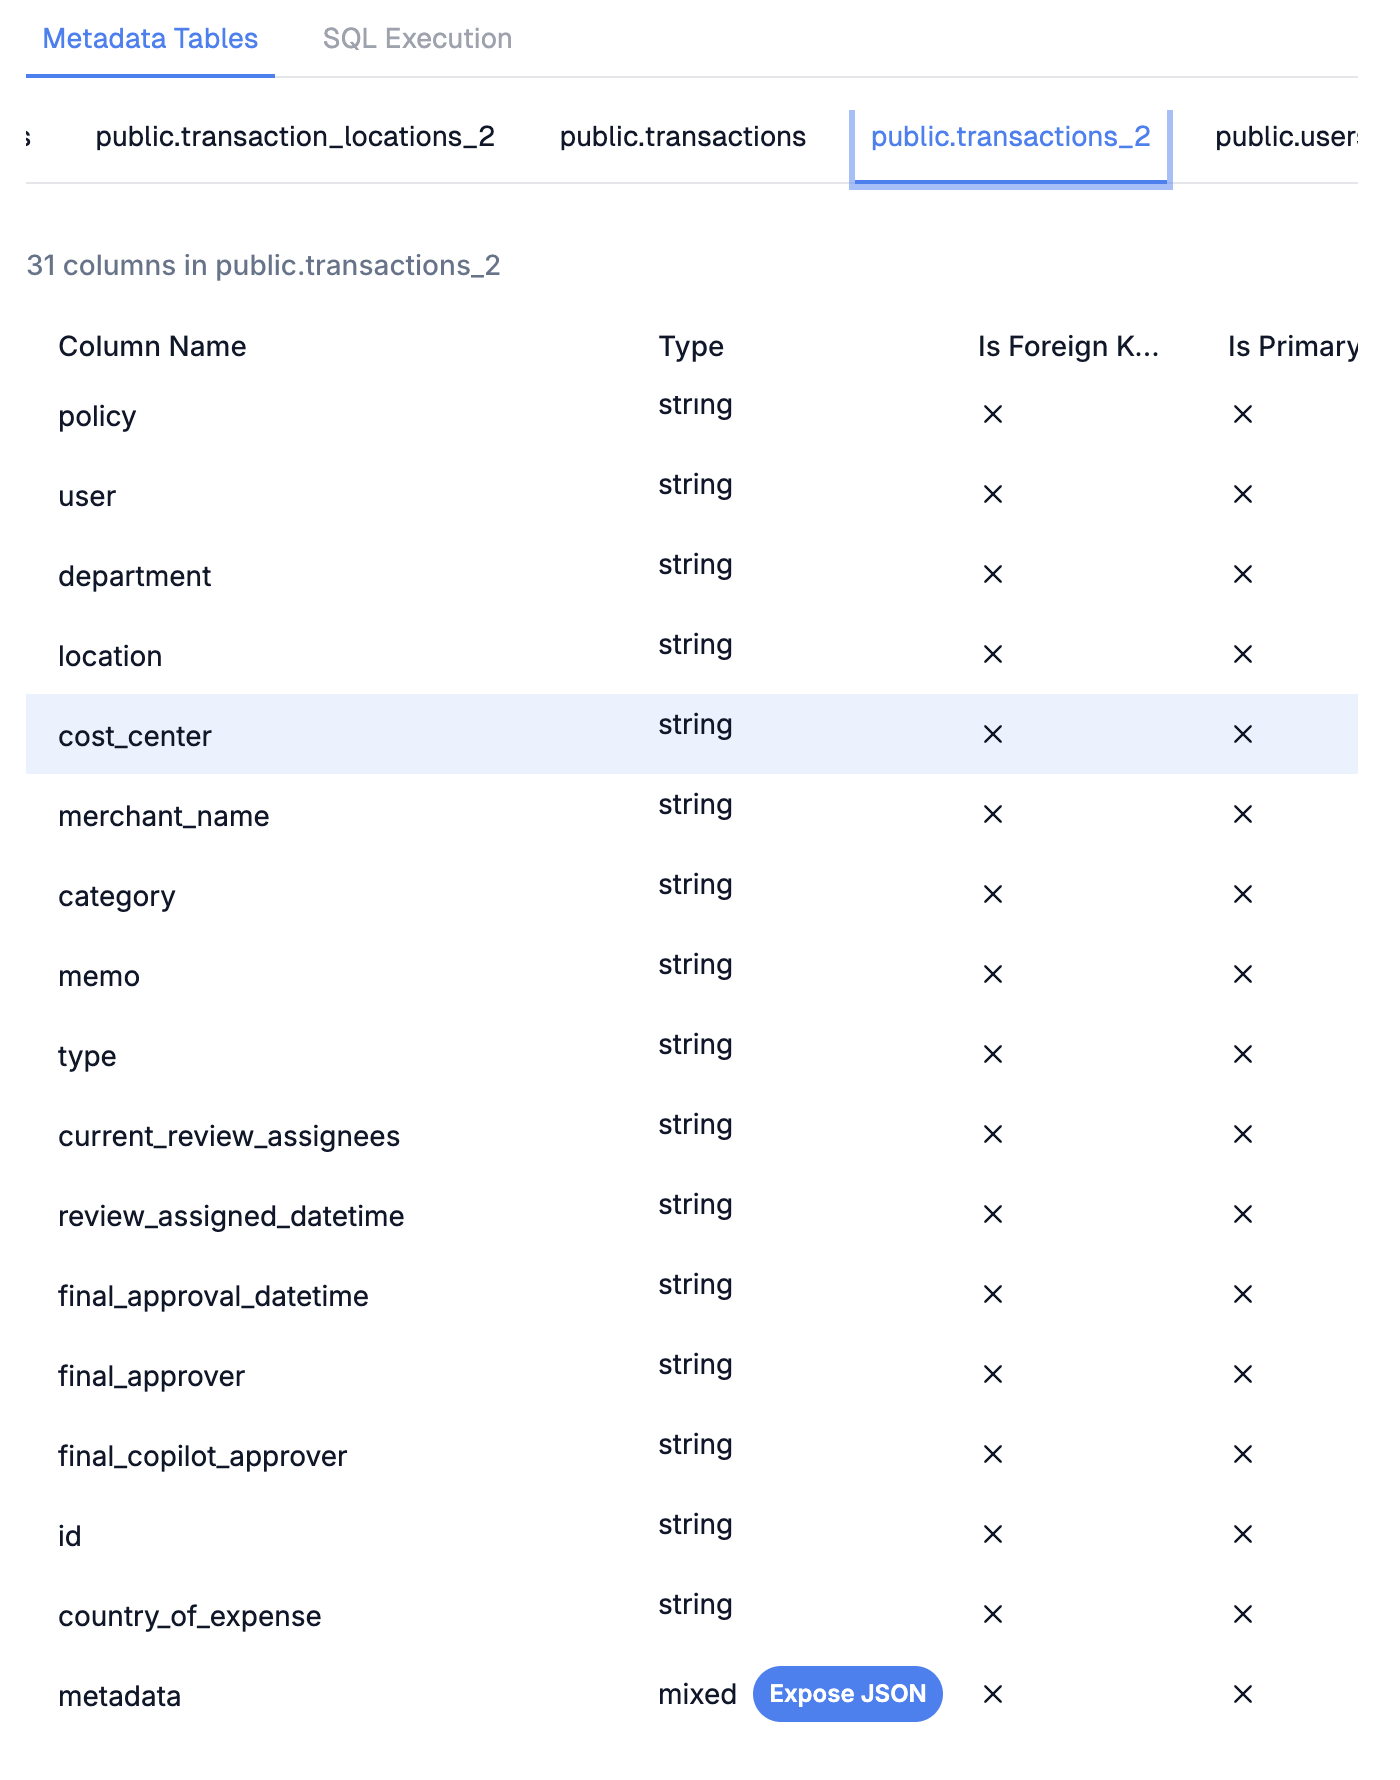
After metadata is refreshed, columns containing JSON data will show a type ofjson.
- In the metadata viewer, select the table containing your JSON column
- Find the column with type
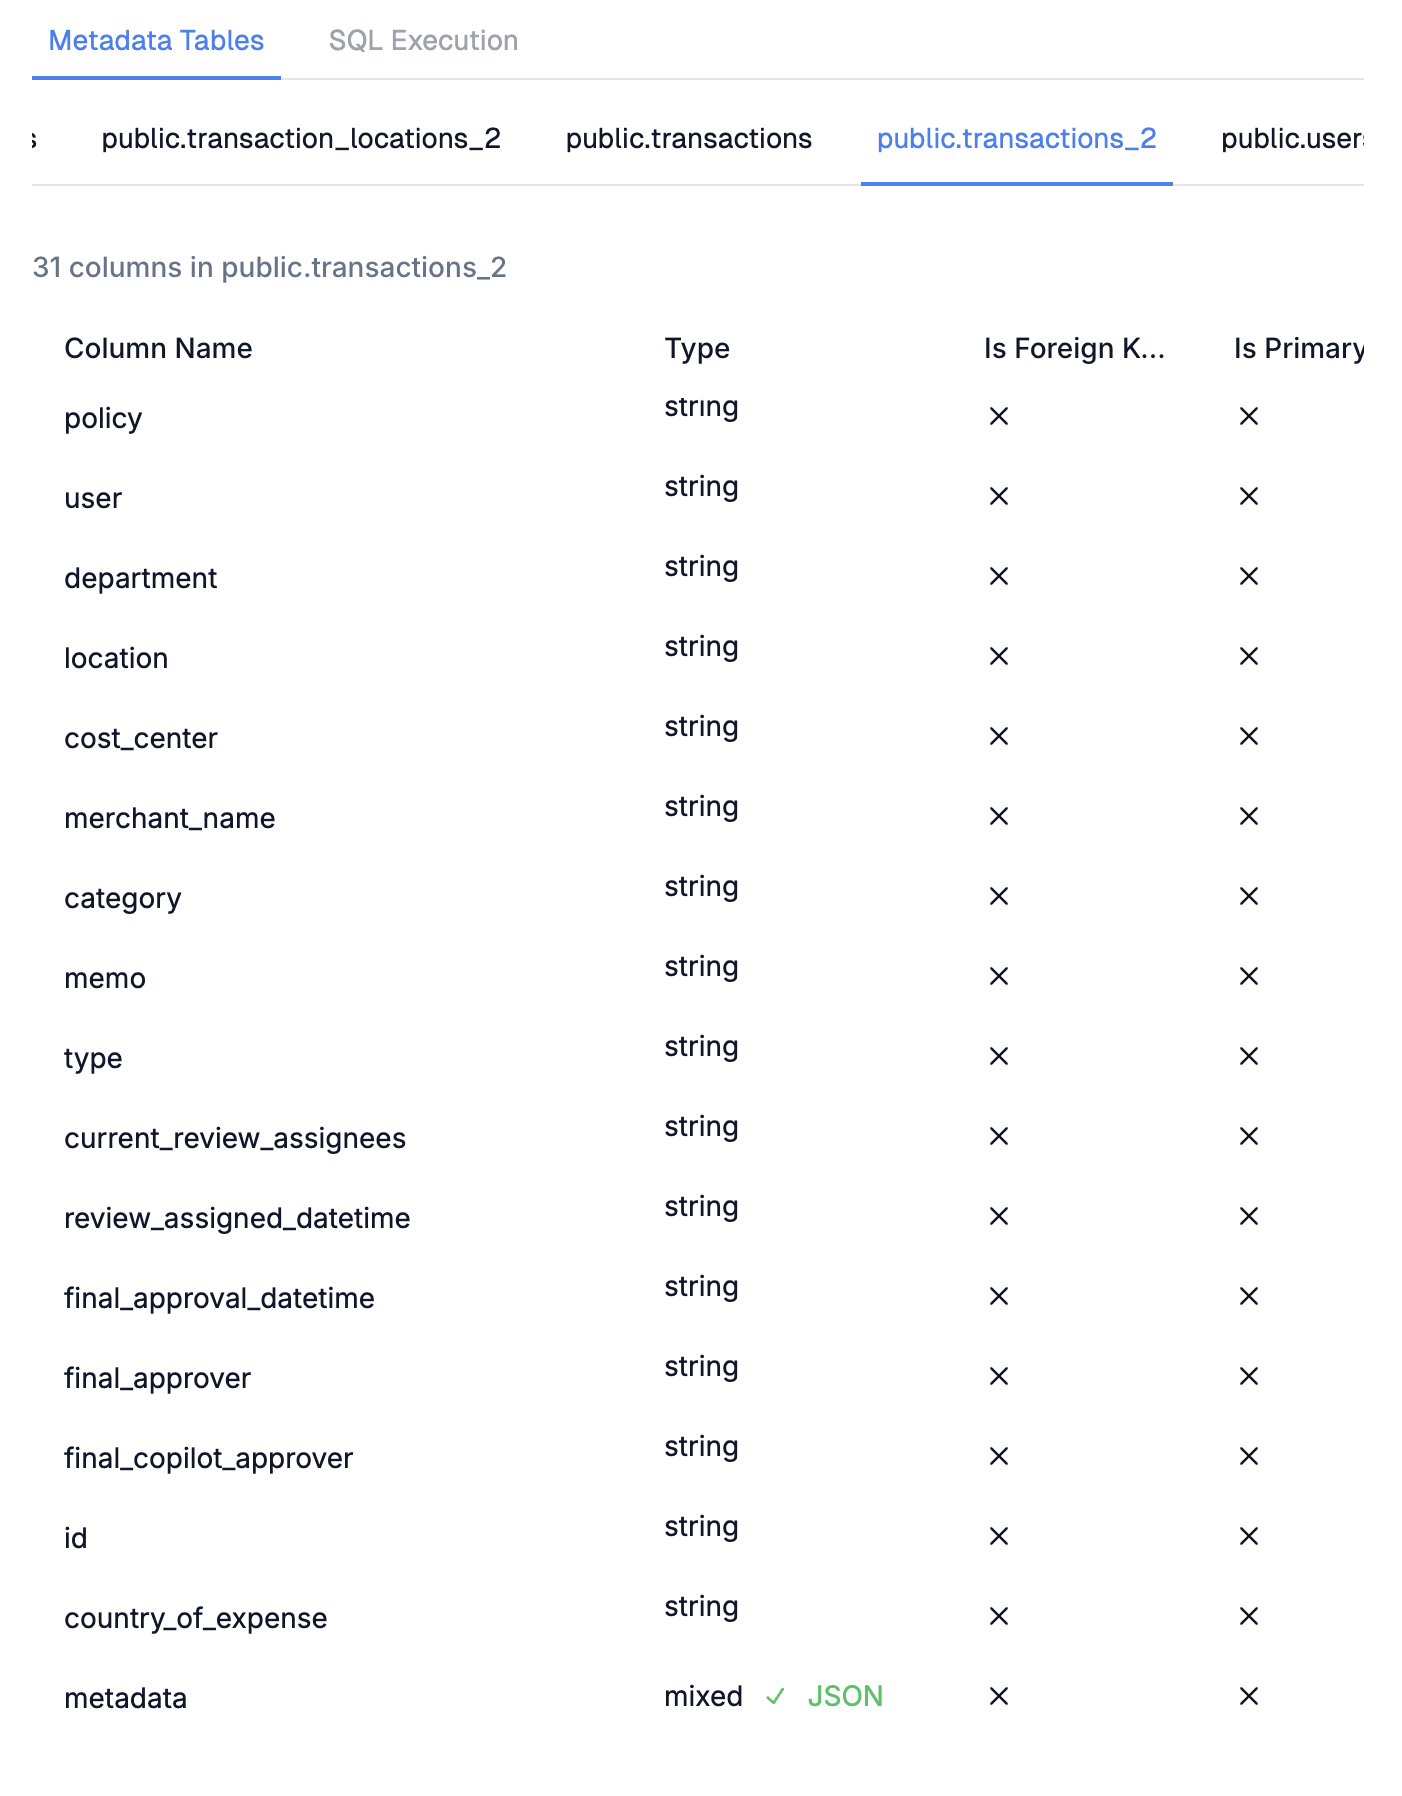
json - Click the Expose JSON button next to it
- A success notification confirms the column is now JSON-parsed
Step 3: Use JSON Fields in Charts
The parsed JSON properties are now available as separate columns when building charts.- Go to your Dashboard
- Create a new chart or edit an existing one
- In the Raw Tables section, select the table with the JSON column
- Save the chart
metadata.region, metadata.plan).
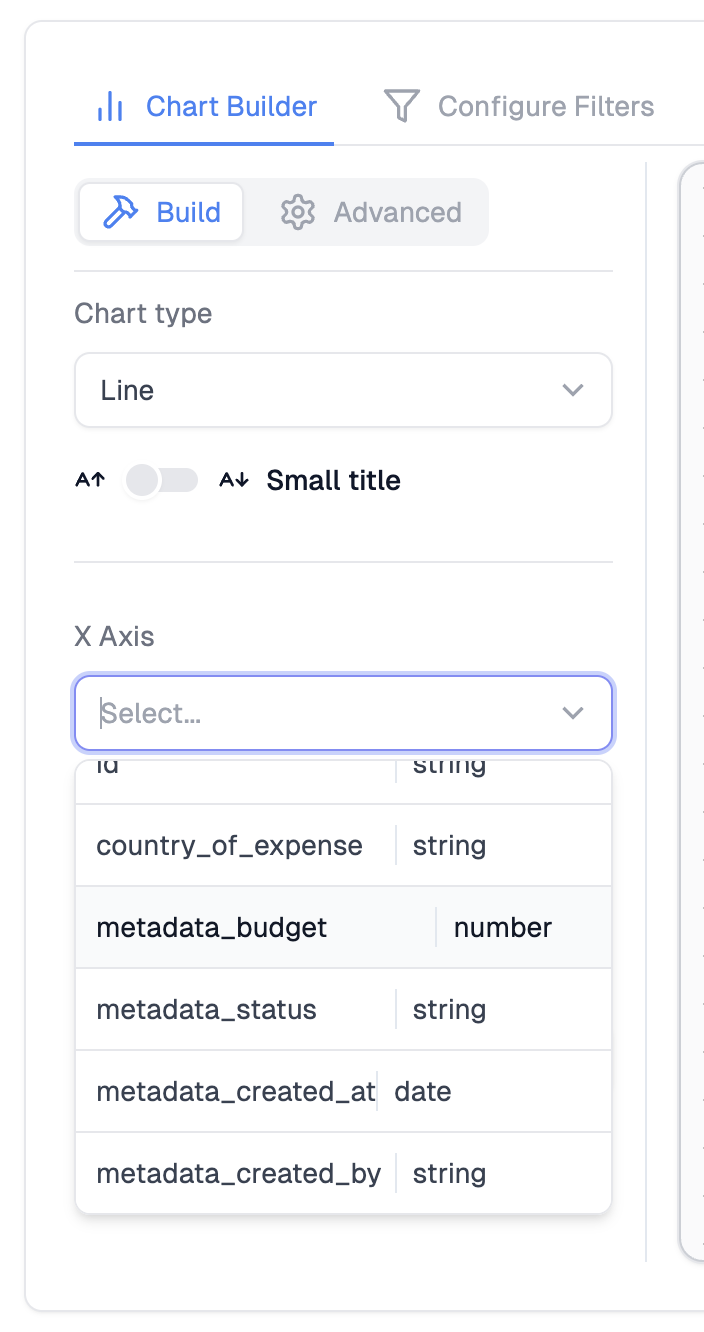
- X-Axis and Y-Axis values
- Group By segmentation
- Aggregations (sum, count, avg on numeric JSON properties)
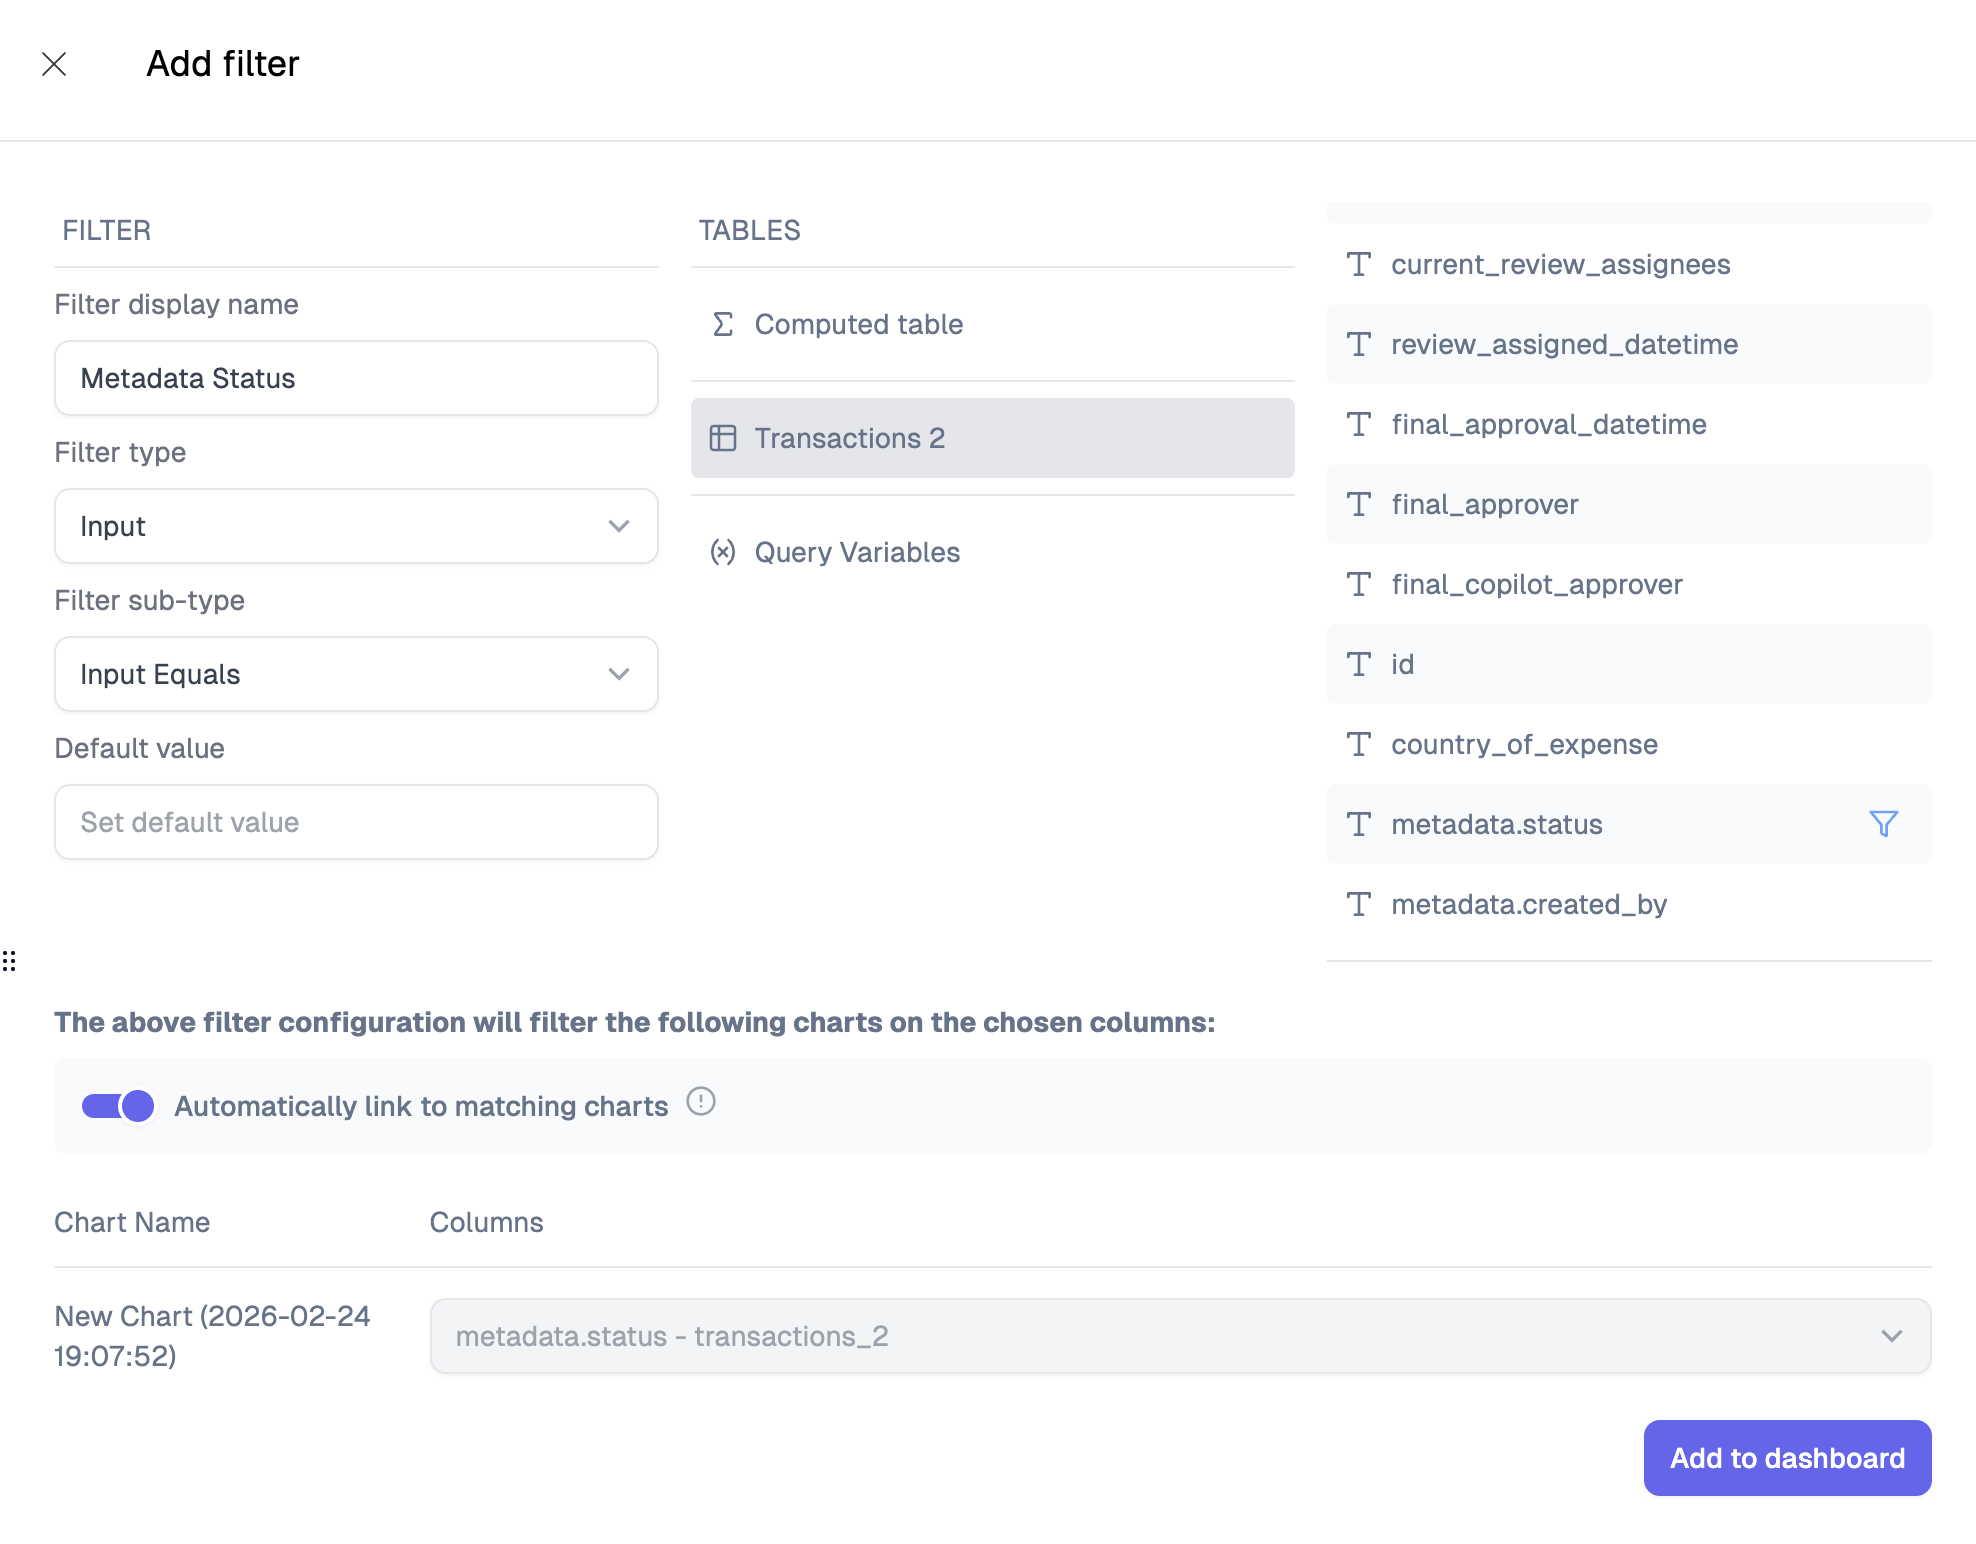
Step 4: Filter by JSON Fields
Parsed JSON fields also appear in the filter panel, letting users filter dashboards by nested properties.- Open the Filters section of your dashboard or chart
- After selecting raw tables, the nested JSON properties appear in the filter column dropdown
- Select a JSON property to filter by (e.g.,
metadata.region) - Choose a filter type (equals, contains, etc.) and set the value
- Input filters (equals, contains, starts with)
- Select filters (single and multi-select)
- Number filters (greater than, less than, equal to) for numeric JSON properties
- Date filters for date-typed JSON properties
Notes
- JSON parsing happens at query time. The original JSON column is replaced by its expanded properties in the chart’s SQL query.
- If the JSON structure changes (new keys added), recompute metadata and re-save the chart to pick up new fields.
- Column names use dot notation (e.g.,
metadata.region) to indicate nesting. - Deeply nested JSON is supported - each level is separated by dots (e.g.,
metadata.address.city).