

What is an Application?
An Application is a container for dashboard templates that you deploy to your customers. It includes:- Chart Templates - Reusable chart configurations
- Dashboard Templates - Layouts combining multiple charts
- Spaces - Customer-specific instances of your templates
- Default Settings - Language, timezone, export options
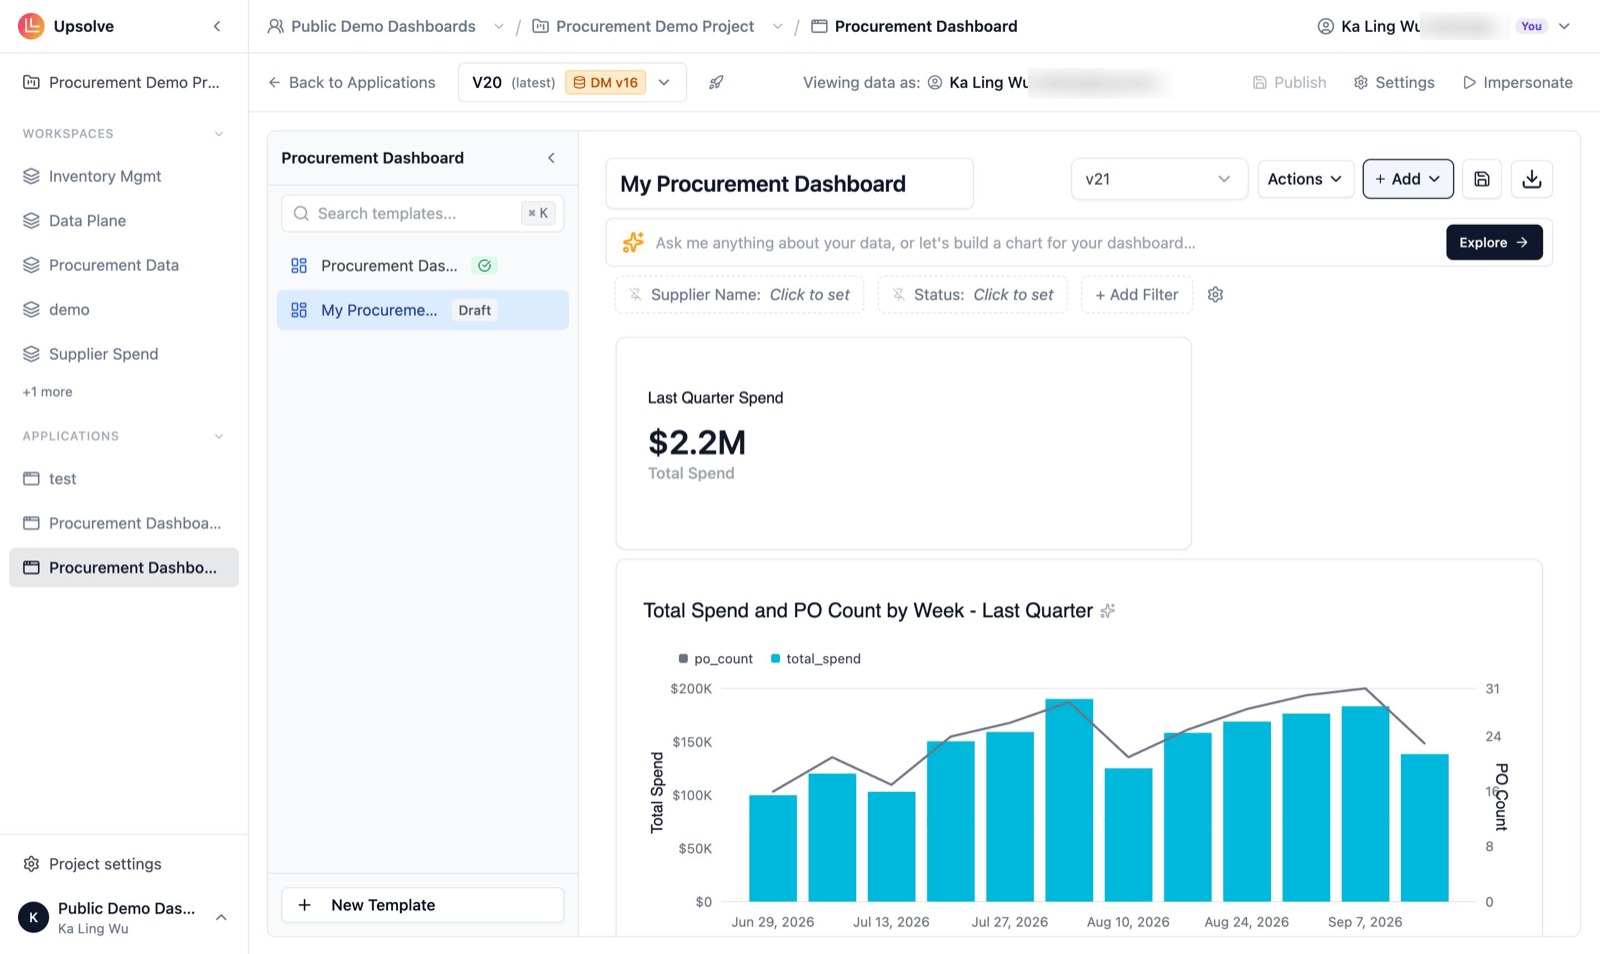
How Applications and Spaces Work
Each space receives its own private copies of your published templates. When you publish a template:- It becomes available to all spaces
- Each space gets its own private copy
- Users can customize their copies without affecting others
Creating an Application
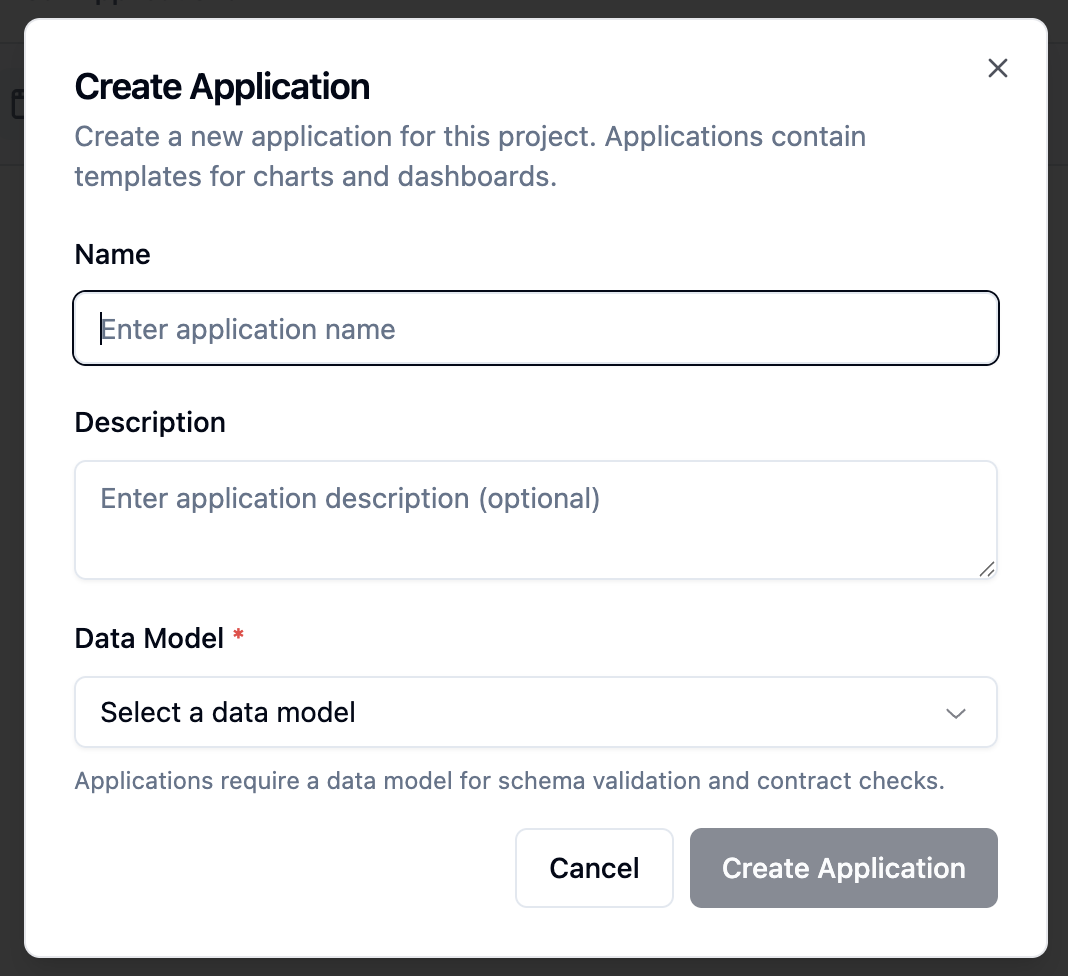
- Navigate to your project’s Applications tab
- Click Create Application
- Enter a name
- Select the workspace whose data model the application should use
- Click Create
Building Templates
Adding Charts to a Template
- Open your application and the dashboard template
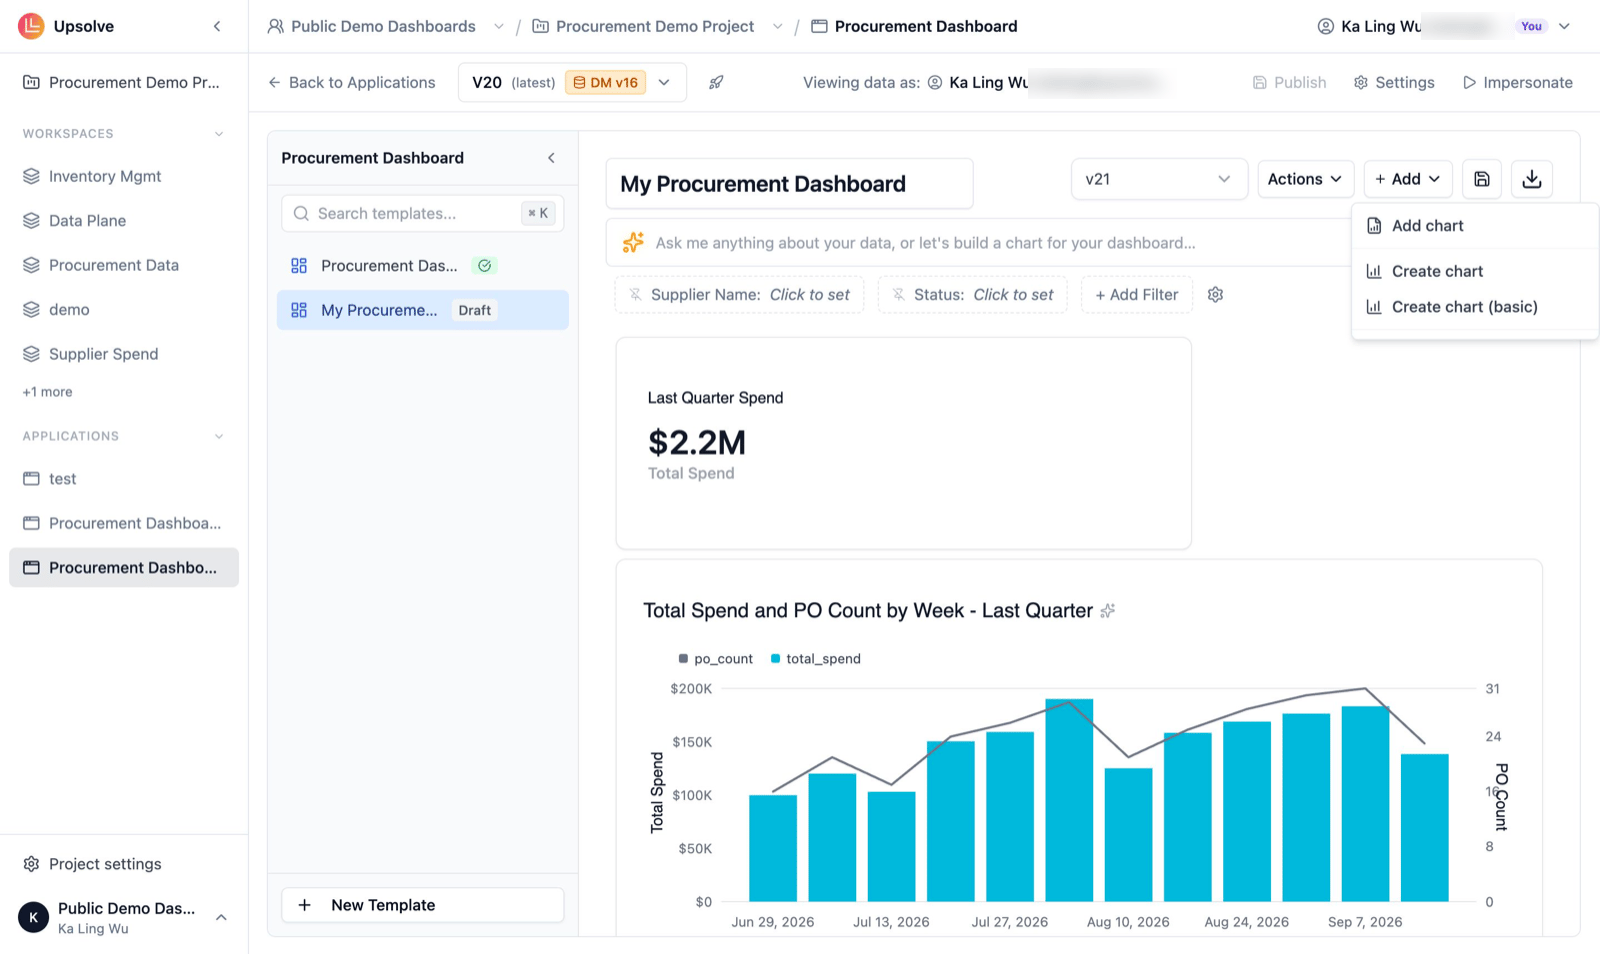
- Click Add and choose how to add the chart:
- Add chart adds a chart you already have
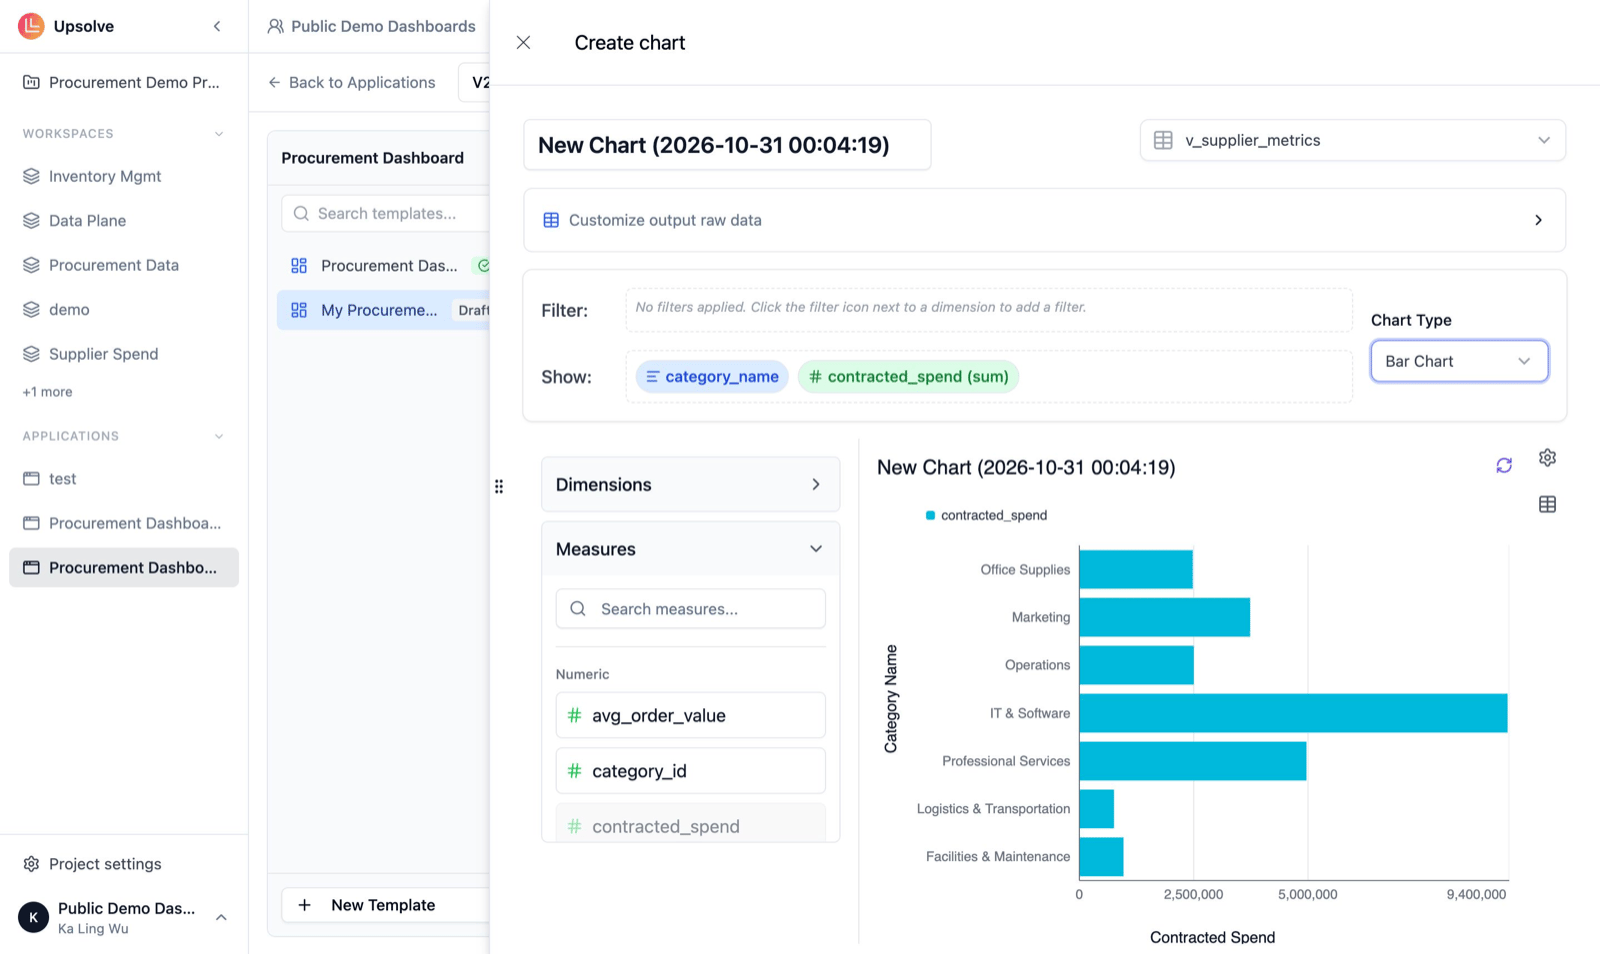
- Create chart opens the full builder: pick the tables, prepare the data, then build the chart
- Create chart (basic) opens the quick builder: pick a table, click dimensions and measures, and choose a chart type
- Click Save and add to dashboard
Creating a Dashboard Template
- Open your application
- Click New Template at the foot of the template list
- Add charts from the Add menu, and drag them to arrange the layout
- Add filters with + Add Filter if needed
- Click the save button beside Add
Viewing as a User
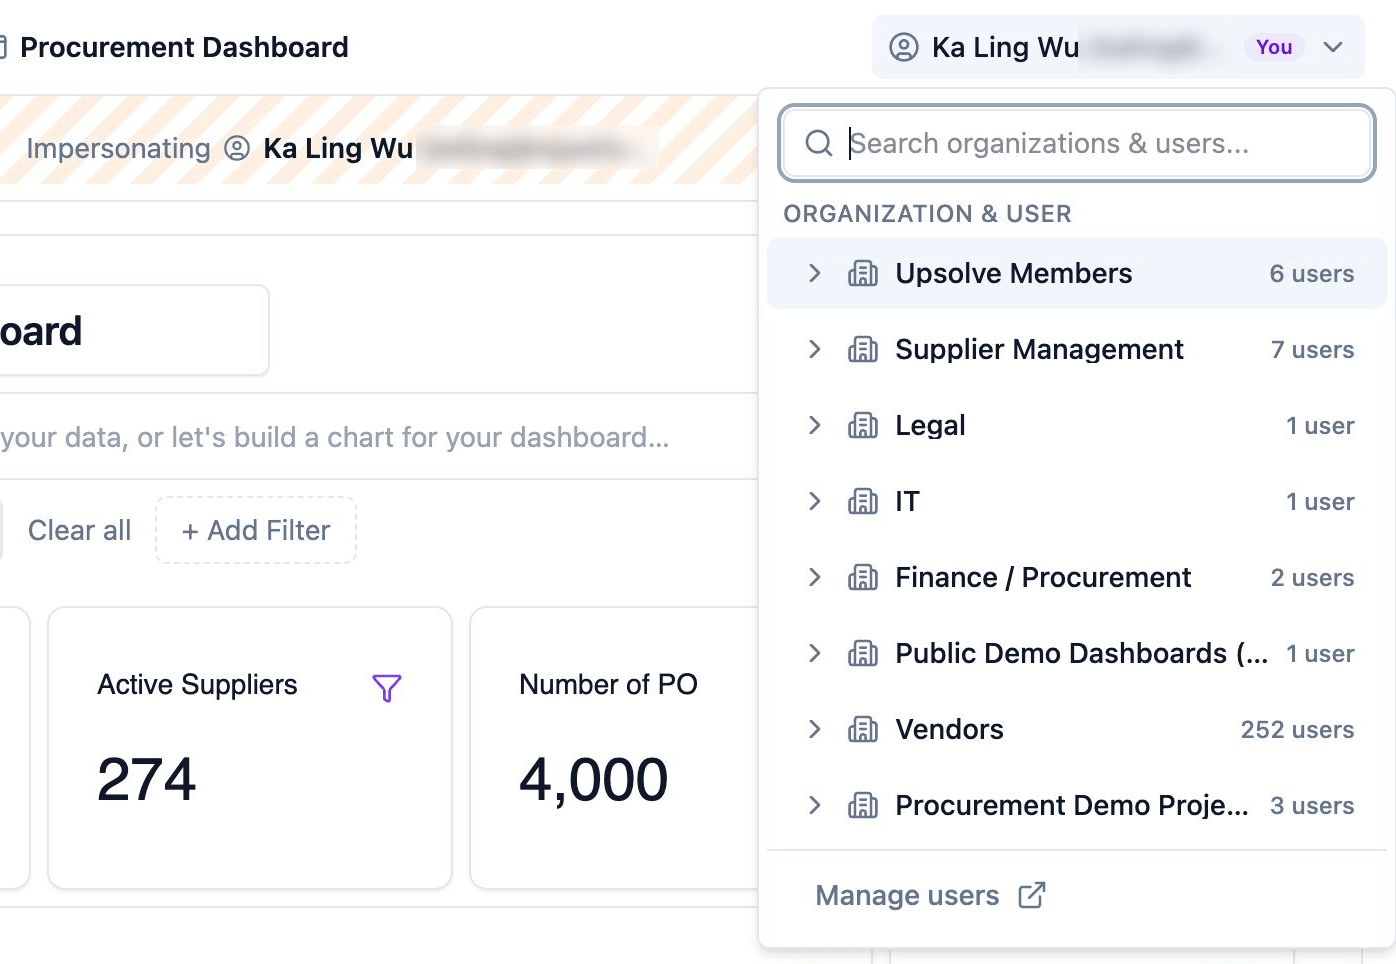
While building templates, you see them as an admin. To see what users will see:- Click Impersonate in the header
- Pick an organization and user from the dropdown at the top right
- The view switches to their space, with their data filtered by their RLS rules
- Check that the template works for different users, then click Stop
Publishing Templates
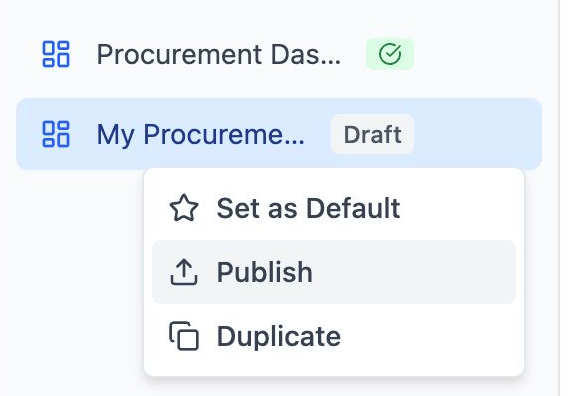
Templates start in “draft” mode. To make them available to users:- Open the ⋯ menu beside the template in the template list
- Click Publish
- The template propagates to all spaces
What Happens When You Publish
- Template status changes to “published”
- Each space gets a copy of the dashboard
- Users can now see and interact with it
- Future updates require re-publishing
Understanding Spaces
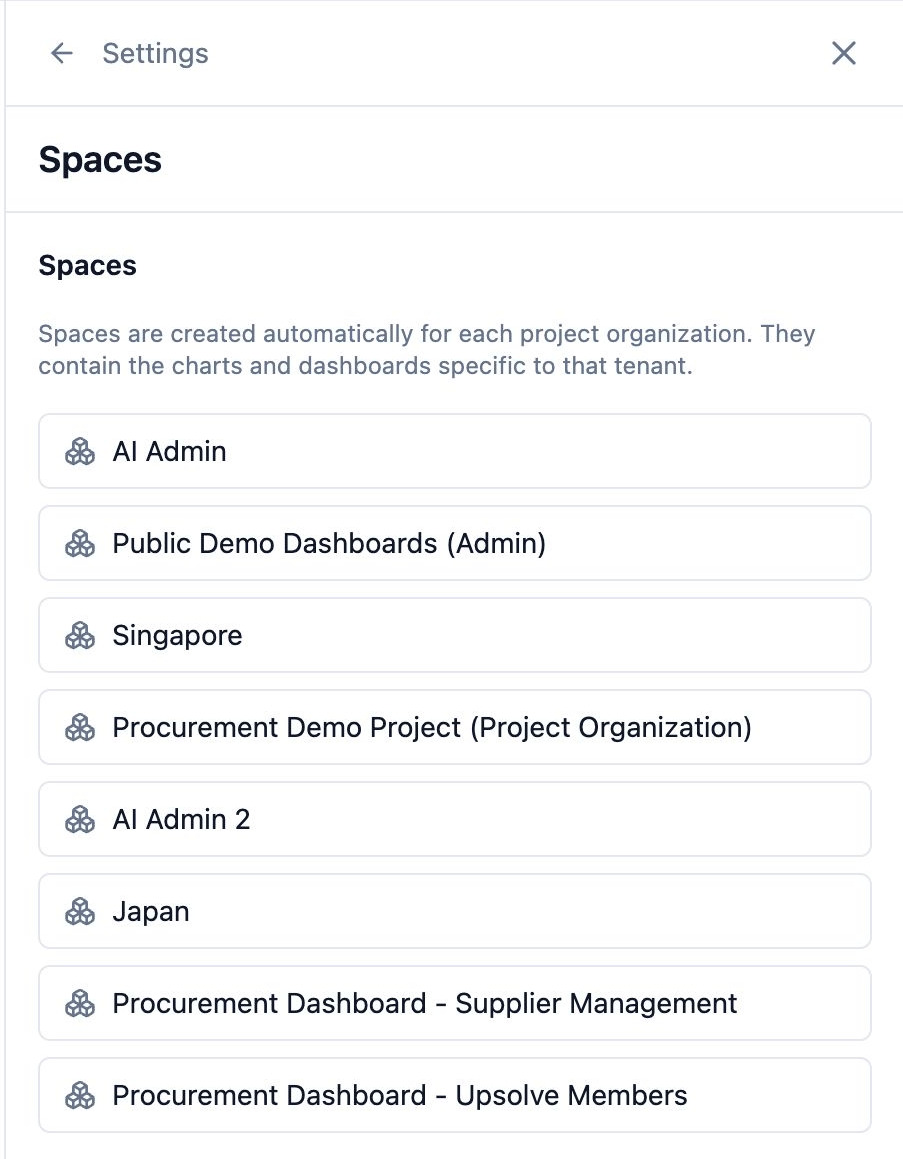
Each project organization automatically gets a Space for each application.What’s in a Space?
- Template Copies - Private instances of published templates
- User Dashboards - Dashboards users create themselves
- User Charts - Charts users create themselves
Viewing Spaces
- Open your application and click Settings in the header
- Click Spaces
- See all spaces (one per organization)
Default Views
You can set which dashboard users see first when they open their space.Setting an Application Default
- Open your application
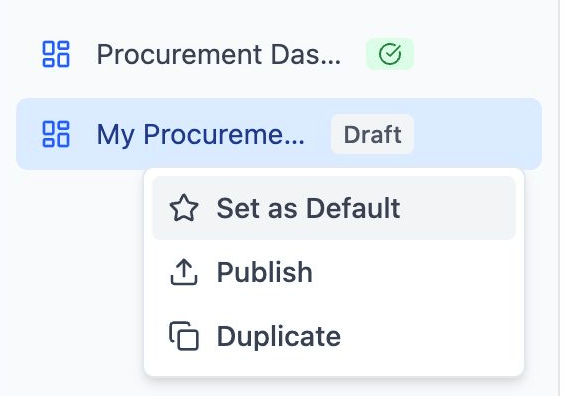
- Open the ⋯ menu beside a template in the template list
- Click Set as Default
- This becomes the default for all users
User-Specific Defaults
Users can change their own default:- Open any dashboard in their space
- Click Set as Default
- This overrides the application default for them only
Application Settings
Click Settings in the application header. The panel shows the application’s name, ID and data model, and these sections: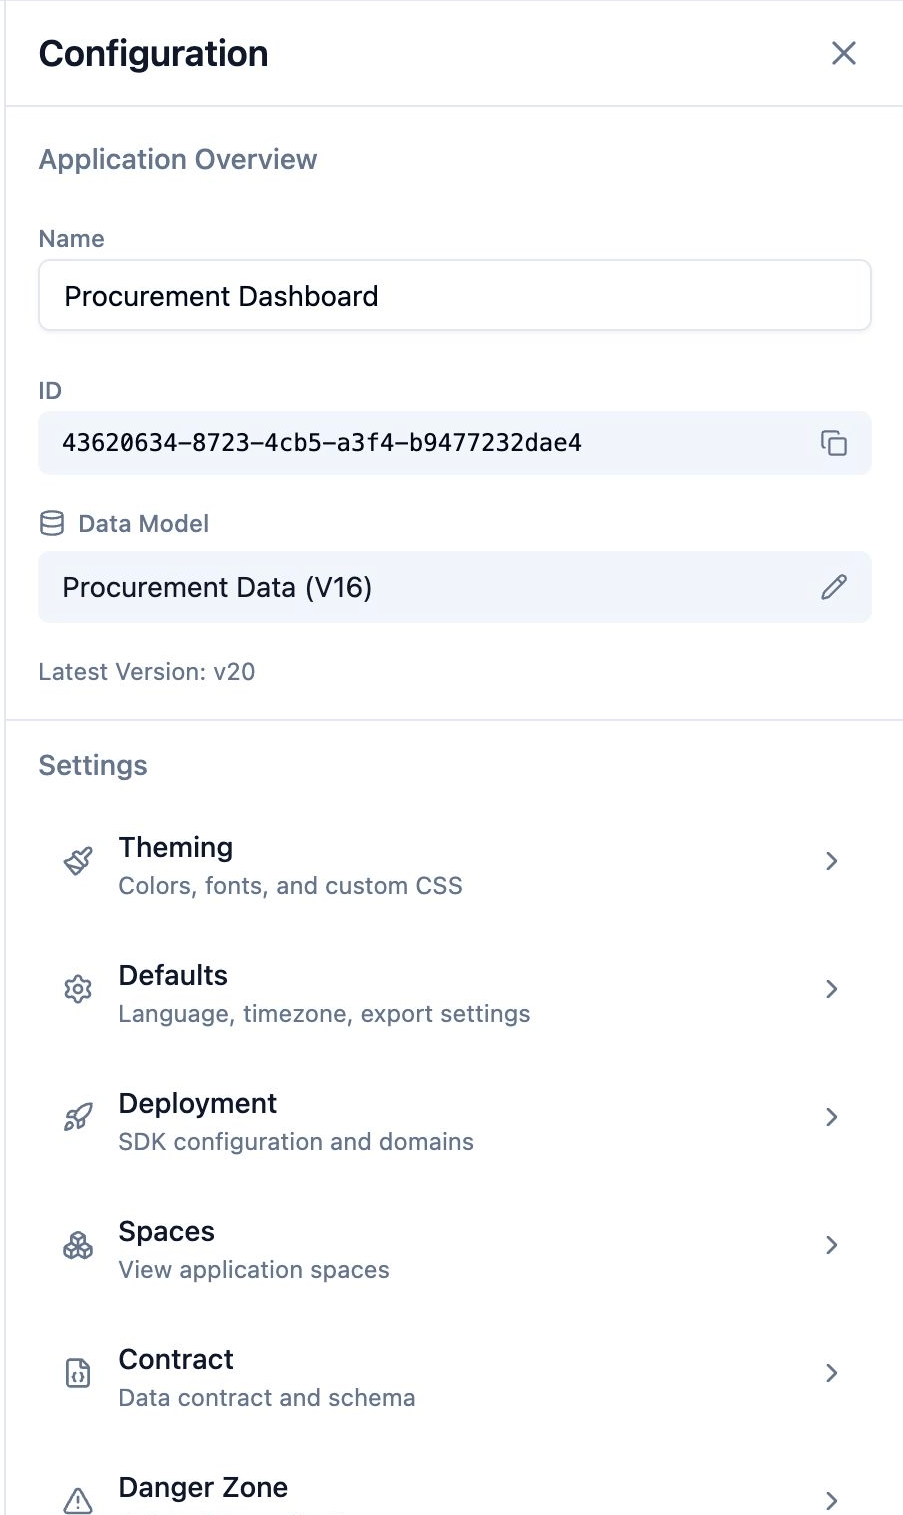
Production Status
Applications can be set to production, like workspaces can.Requirements
- Application must have a linked data model
- That data model version must be production
- All template schemas must fit within the data model
Setting Production
- Open your application
- Pick the version in the version switcher beside Back to Applications
- Click the rocket button beside it (Mark as prod)
- Validation runs automatically
Connecting Agents and Applications
If an application is linked to the same data model as a workspace:- The workspace’s agent can generate charts compatible with the application
- Users can save agent-generated charts to their space
- Charts flow seamlessly between AI and dashboards
Best Practices
1. Test with Multiple Users
Always preview templates as different users to ensure RLS works correctly.2. Start with Core Dashboards
Create 2-3 essential dashboards before adding more.3. Use Consistent Naming
Name templates clearly so users understand what they show.4. Document in Descriptions
Add descriptions to dashboards explaining what they display.Next Steps
- Follow the Complete Setup Guide for the full workflow
- Learn about Data Governance for data filtering